Copyright
©The Author(s) 2019.
World J Gastroenterol. Oct 7, 2019; 25(37): 5590-5603
Published online Oct 7, 2019. doi: 10.3748/wjg.v25.i37.5590
Published online Oct 7, 2019. doi: 10.3748/wjg.v25.i37.5590
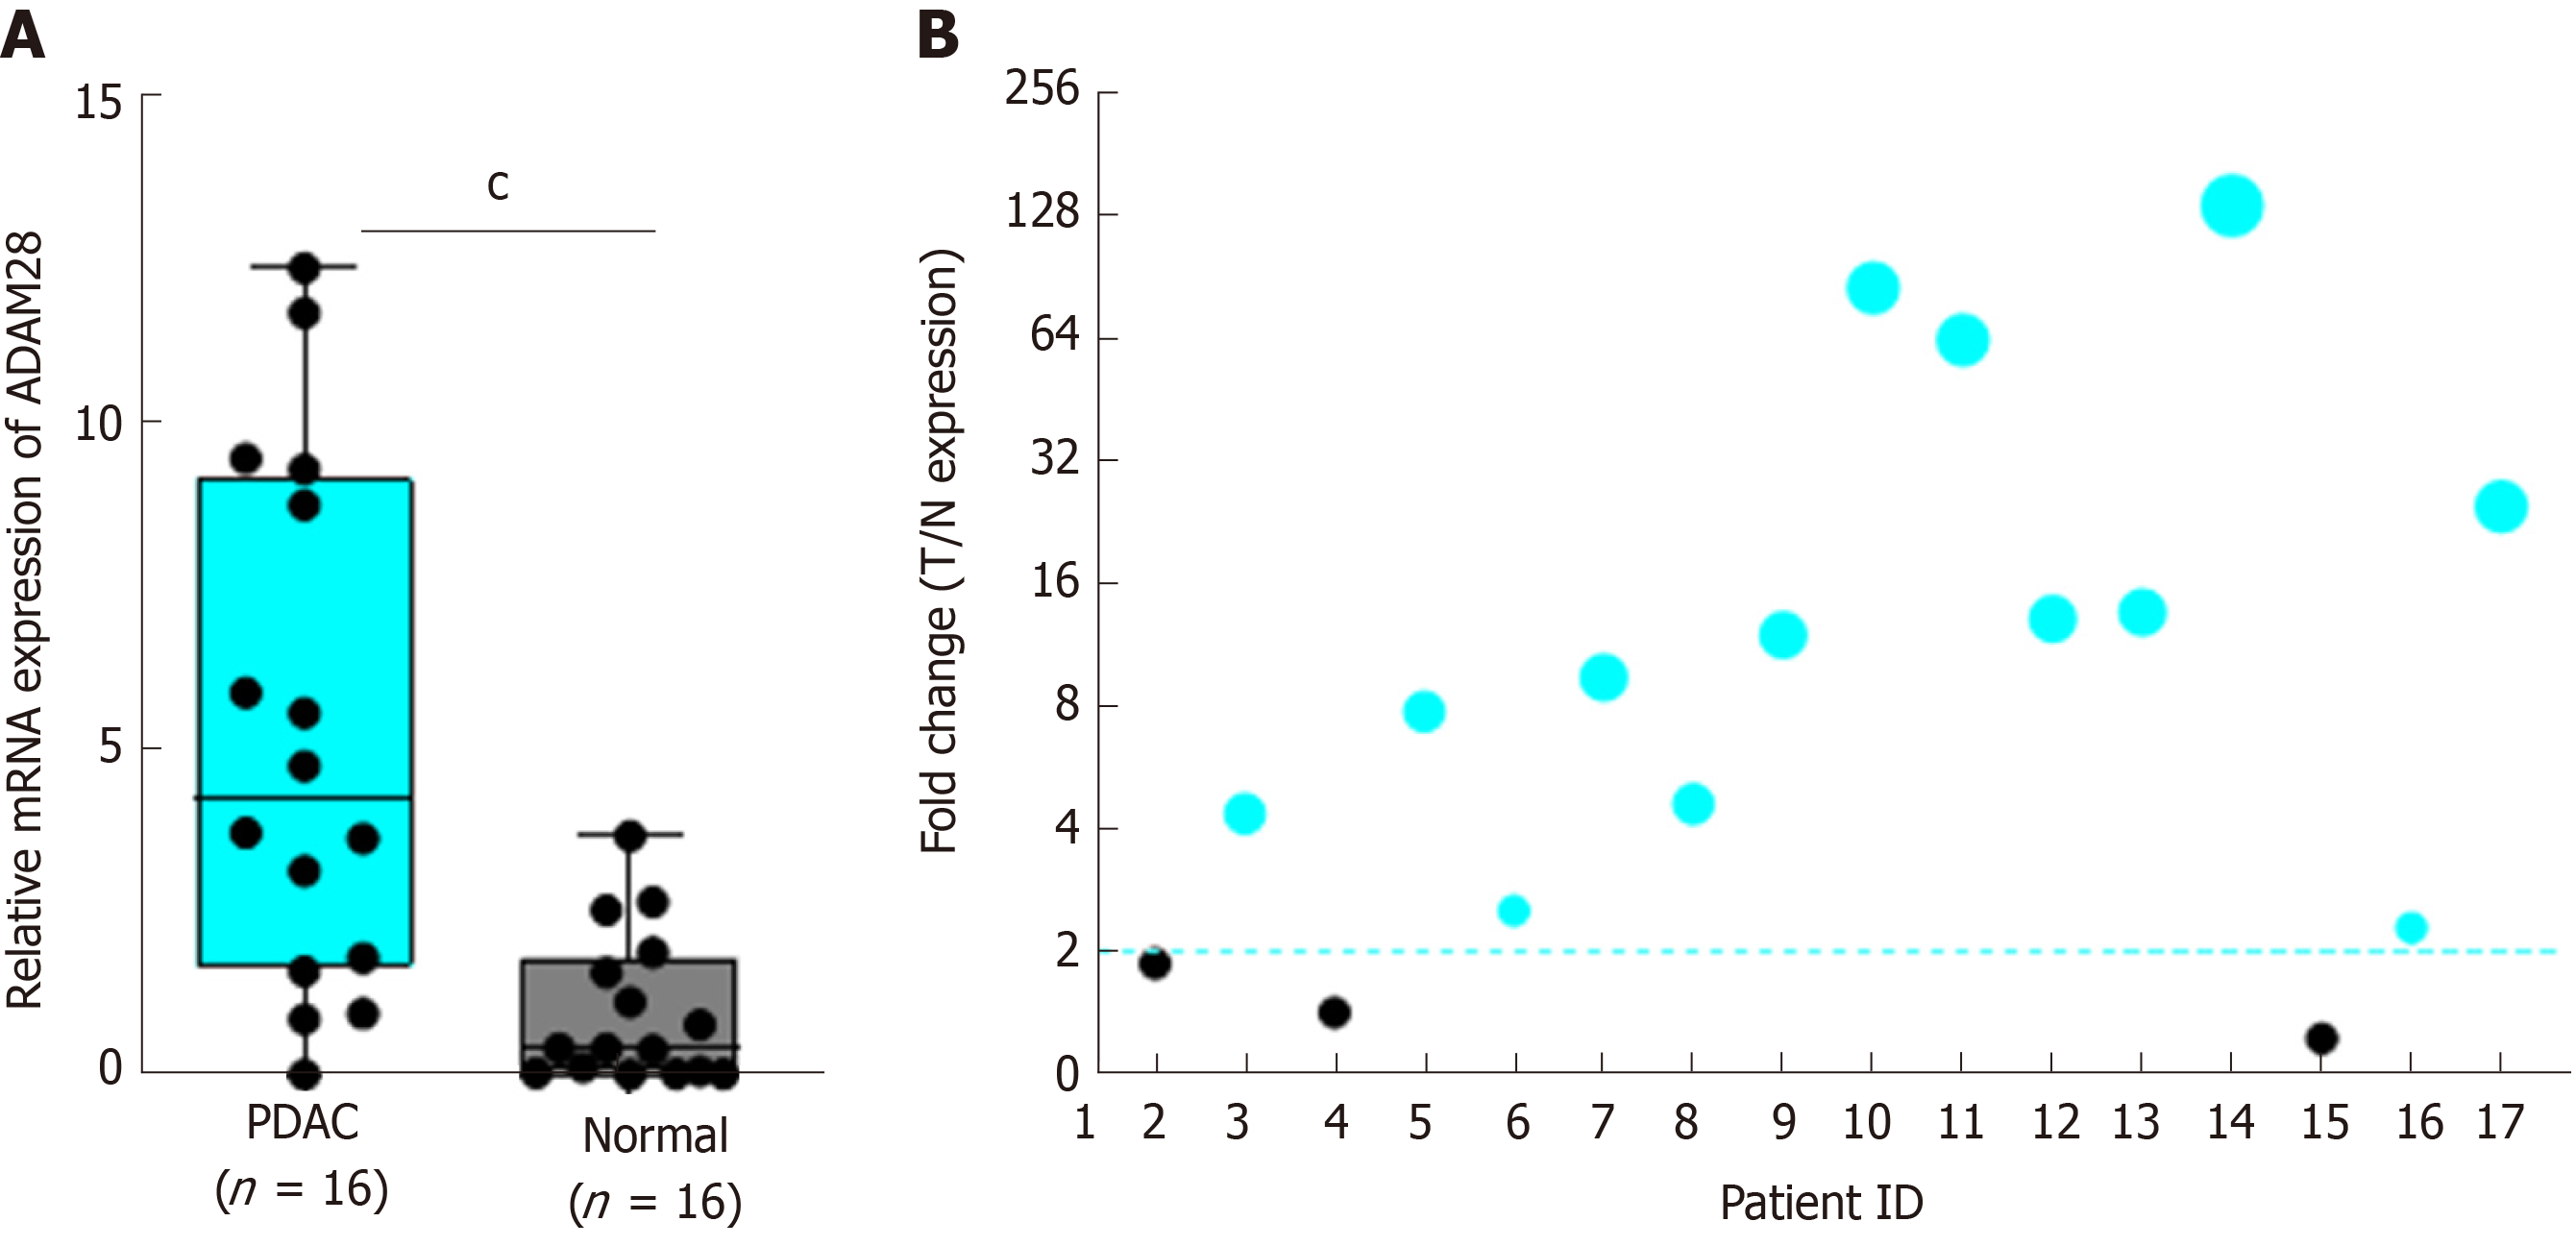
Figure 3 Expression of ADAM28 in collected clinical pancreatic cancer tissues.
A: A total of 16 pancreatic cancer tissues and the corresponding adjacent normal tissues were analyzed. cP < 0.001 vs normal group; B: The respective ratio between tumor and adjacent normal tissues (T/N) showed as a bubble chart. T: Tumor tissue; N: Normal tissue; PDAC: Pancreatic ductal adenocarcinoma.
- Citation: Wei L, Wen JY, Chen J, Ma XK, Wu DH, Chen ZH, Huang JL. Oncogenic ADAM28 induces gemcitabine resistance and predicts a poor prognosis in pancreatic cancer. World J Gastroenterol 2019; 25(37): 5590-5603
- URL: https://www.wjgnet.com/1007-9327/full/v25/i37/5590.htm
- DOI: https://dx.doi.org/10.3748/wjg.v25.i37.5590


