Copyright
©The Author(s) 2019.
World J Gastroenterol. Sep 28, 2019; 25(36): 5451-5468
Published online Sep 28, 2019. doi: 10.3748/wjg.v25.i36.5451
Published online Sep 28, 2019. doi: 10.3748/wjg.v25.i36.5451
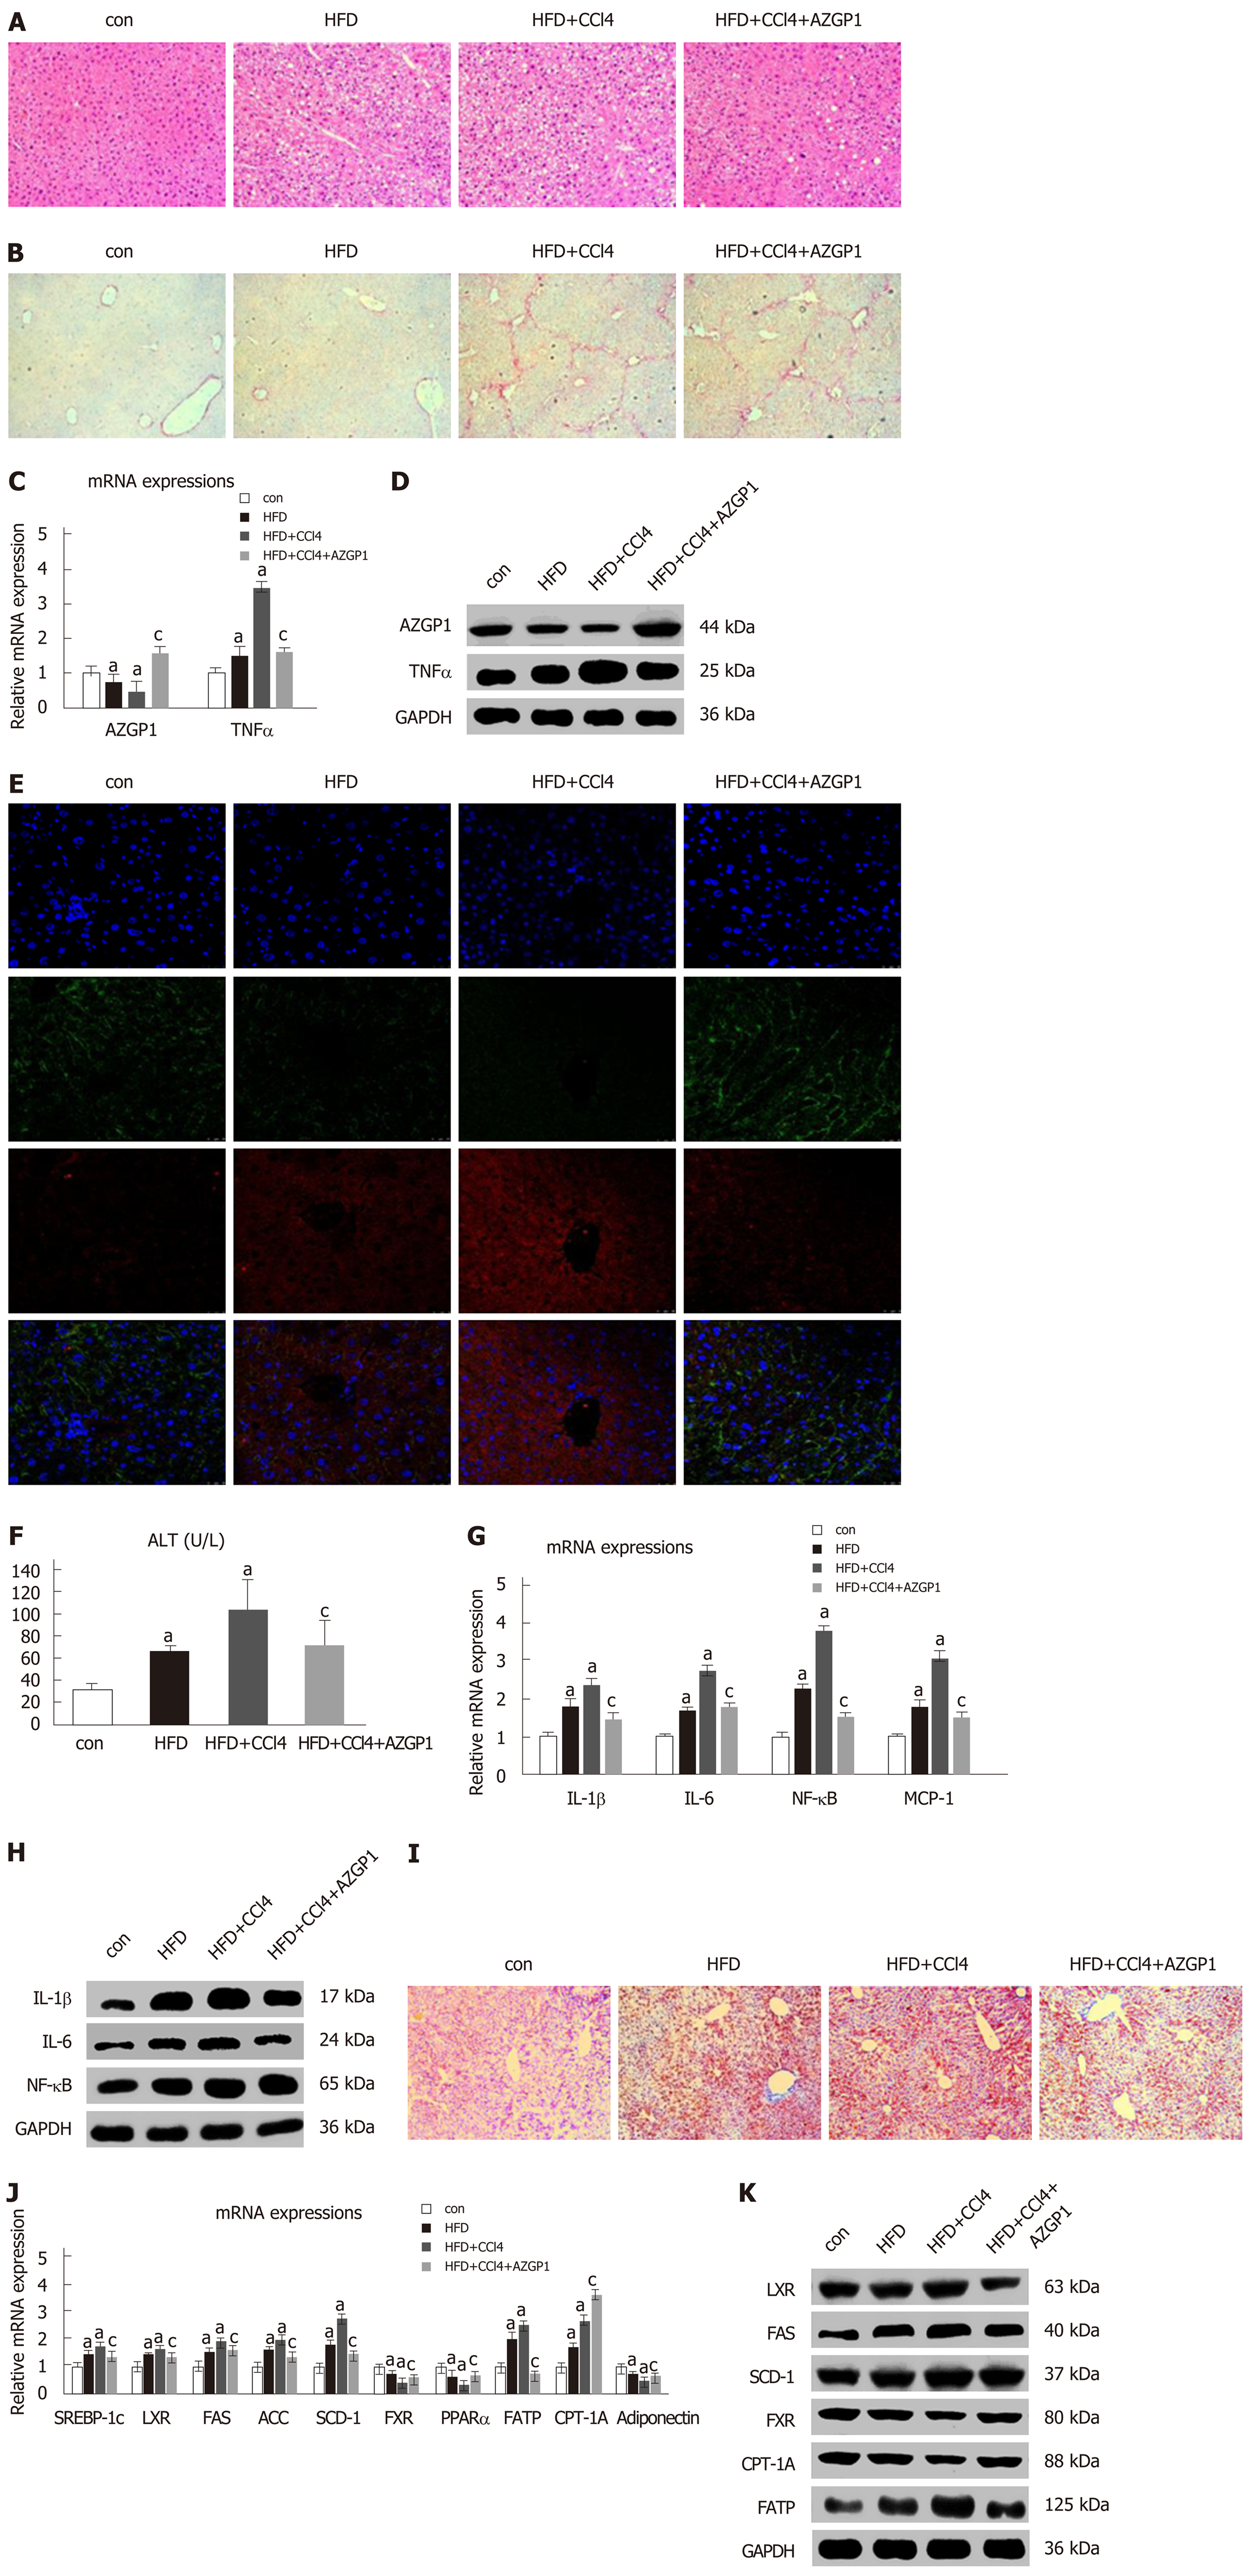
Figure 6 Expression of AZGP1/TNF-α, inflammation, and lipid metabolism regulation by AZGP1 in the non-alcoholic fatty liver disease mouse model.
Liver tissue images after HE (A) and Sirius red (B) staining are shown in four mouse groups [control (con), HFD, HFD + CCl4, and HFD + CCl4 + AZGP1]. Levels of AZGP1 and TNF-α mRNA (C) and protein (D) were detected in the four mouse groups. IF staining (E) with DAPI (blue) and for AZGP1 (green) and TNF-α (red) was also examined in mice. Serum ALT levels (F) were examined using an ELISA kit in the four mouse groups. IL-1β, IL-6, NF-κB, and MCP-1 mRNA (G) and protein (H) expression levels were detected in the four groups. Representative images of ORO staining (I) are shown for the four groups. SREBP-1c, LXR, FAS, ACC, SCD-1, FXR, PPARα, FATP, CPT-1A, and adiponectin mRNA (J) and protein (K) expression was detected in the four groups. aP < 0.05 vs control mice; cP < 0.05 vs HFD + CCl4 mice.
- Citation: Liu T, Luo X, Li ZH, Wu JC, Luo SZ, Xu MY. Zinc-α2-glycoprotein 1 attenuates non-alcoholic fatty liver disease by negatively regulating tumour necrosis factor-α. World J Gastroenterol 2019; 25(36): 5451-5468
- URL: https://www.wjgnet.com/1007-9327/full/v25/i36/5451.htm
- DOI: https://dx.doi.org/10.3748/wjg.v25.i36.5451


