Copyright
©The Author(s) 2019.
World J Gastroenterol. Sep 28, 2019; 25(36): 5451-5468
Published online Sep 28, 2019. doi: 10.3748/wjg.v25.i36.5451
Published online Sep 28, 2019. doi: 10.3748/wjg.v25.i36.5451
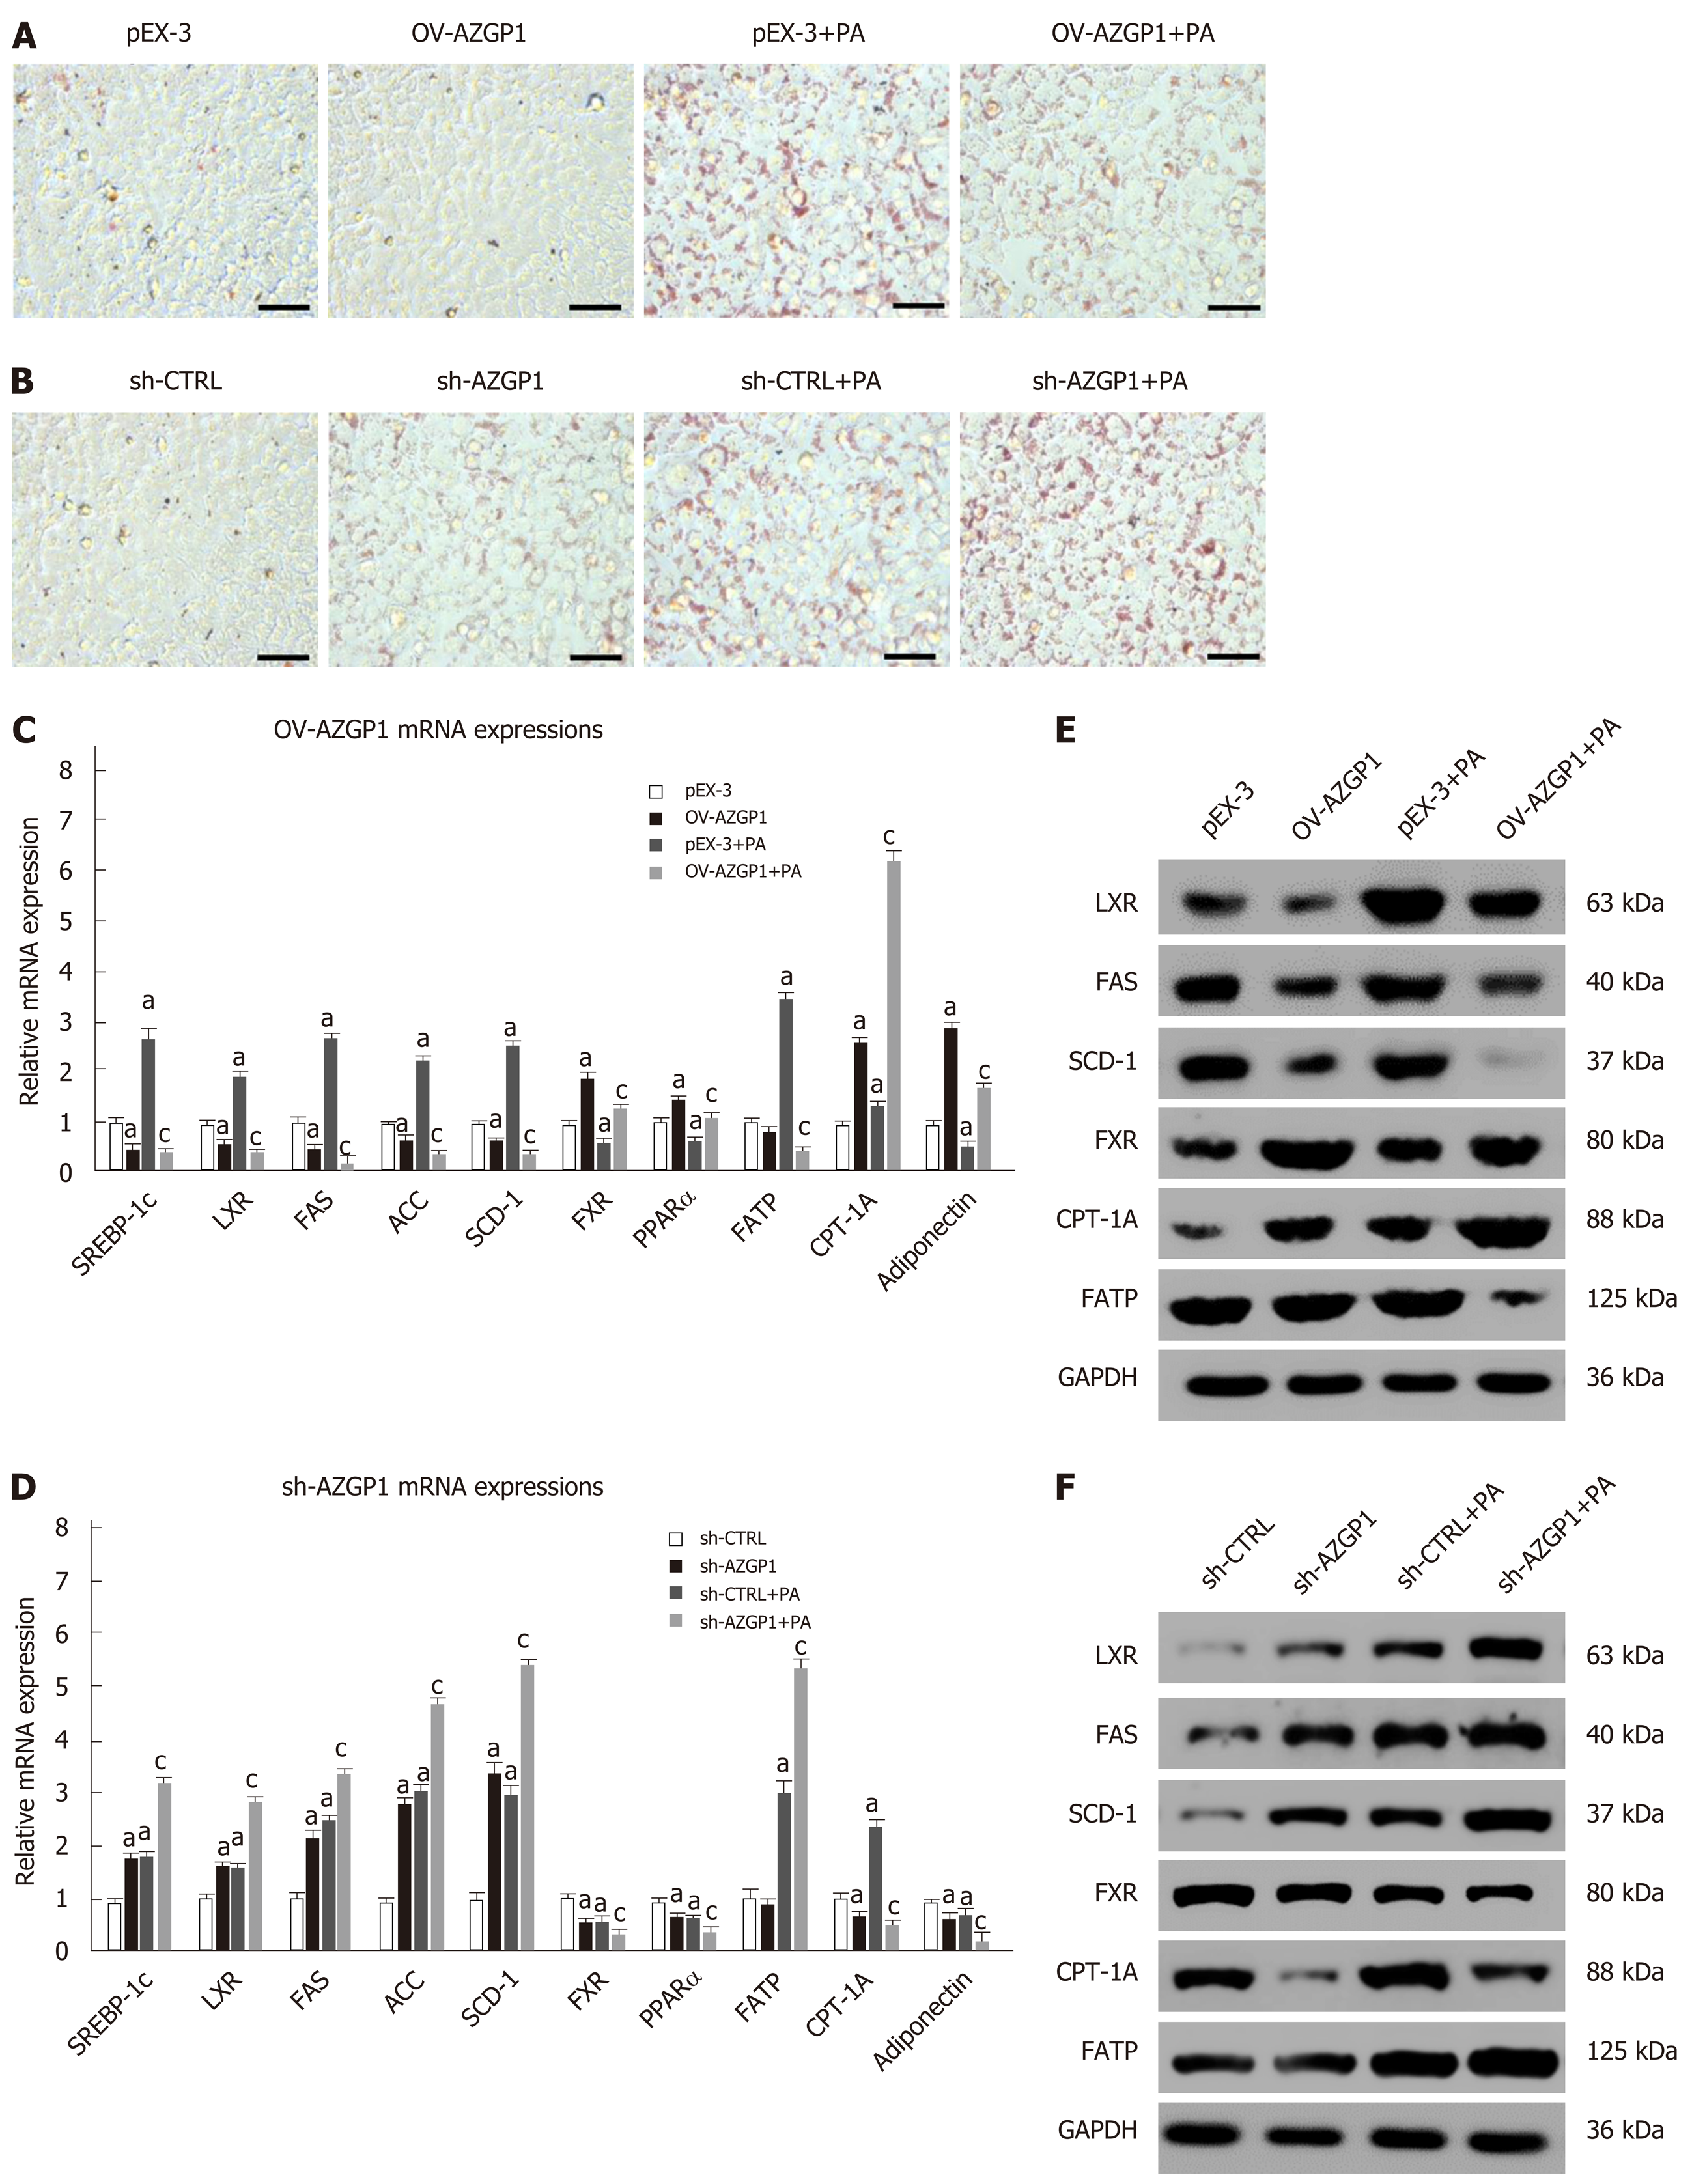
Figure 3 Regulation of lipid metabolism by AZGP1 in LO2 cells.
ORO staining of lipids in LO2 cells is shown in pEX-3 ± PA/OV-AZGP1 ± PA groups (A) and sh-CTRL ± PA/sh-AZGP1 ± PA groups (B). SREBP-1c, LXR, FAS, ACC, SCD-1, FXR, PPAR-α, FATP, CPT-1A, and adiponectin mRNA and protein expression was detected in the pEX-3 ± PA/OV-AZGP1 ± PA groups (C/E) and sh-CTRL ± PA/sh-AZGP1 ± PA groups (D/F). aP < 0.05 vs pEX-3 or sh-CTRL cells; cP < 0.05 vs pEX-3 + PA or sh-CTRL + PA cells.
- Citation: Liu T, Luo X, Li ZH, Wu JC, Luo SZ, Xu MY. Zinc-α2-glycoprotein 1 attenuates non-alcoholic fatty liver disease by negatively regulating tumour necrosis factor-α. World J Gastroenterol 2019; 25(36): 5451-5468
- URL: https://www.wjgnet.com/1007-9327/full/v25/i36/5451.htm
- DOI: https://dx.doi.org/10.3748/wjg.v25.i36.5451


