Copyright
©The Author(s) 2019.
World J Gastroenterol. Sep 21, 2019; 25(35): 5334-5343
Published online Sep 21, 2019. doi: 10.3748/wjg.v25.i35.5334
Published online Sep 21, 2019. doi: 10.3748/wjg.v25.i35.5334
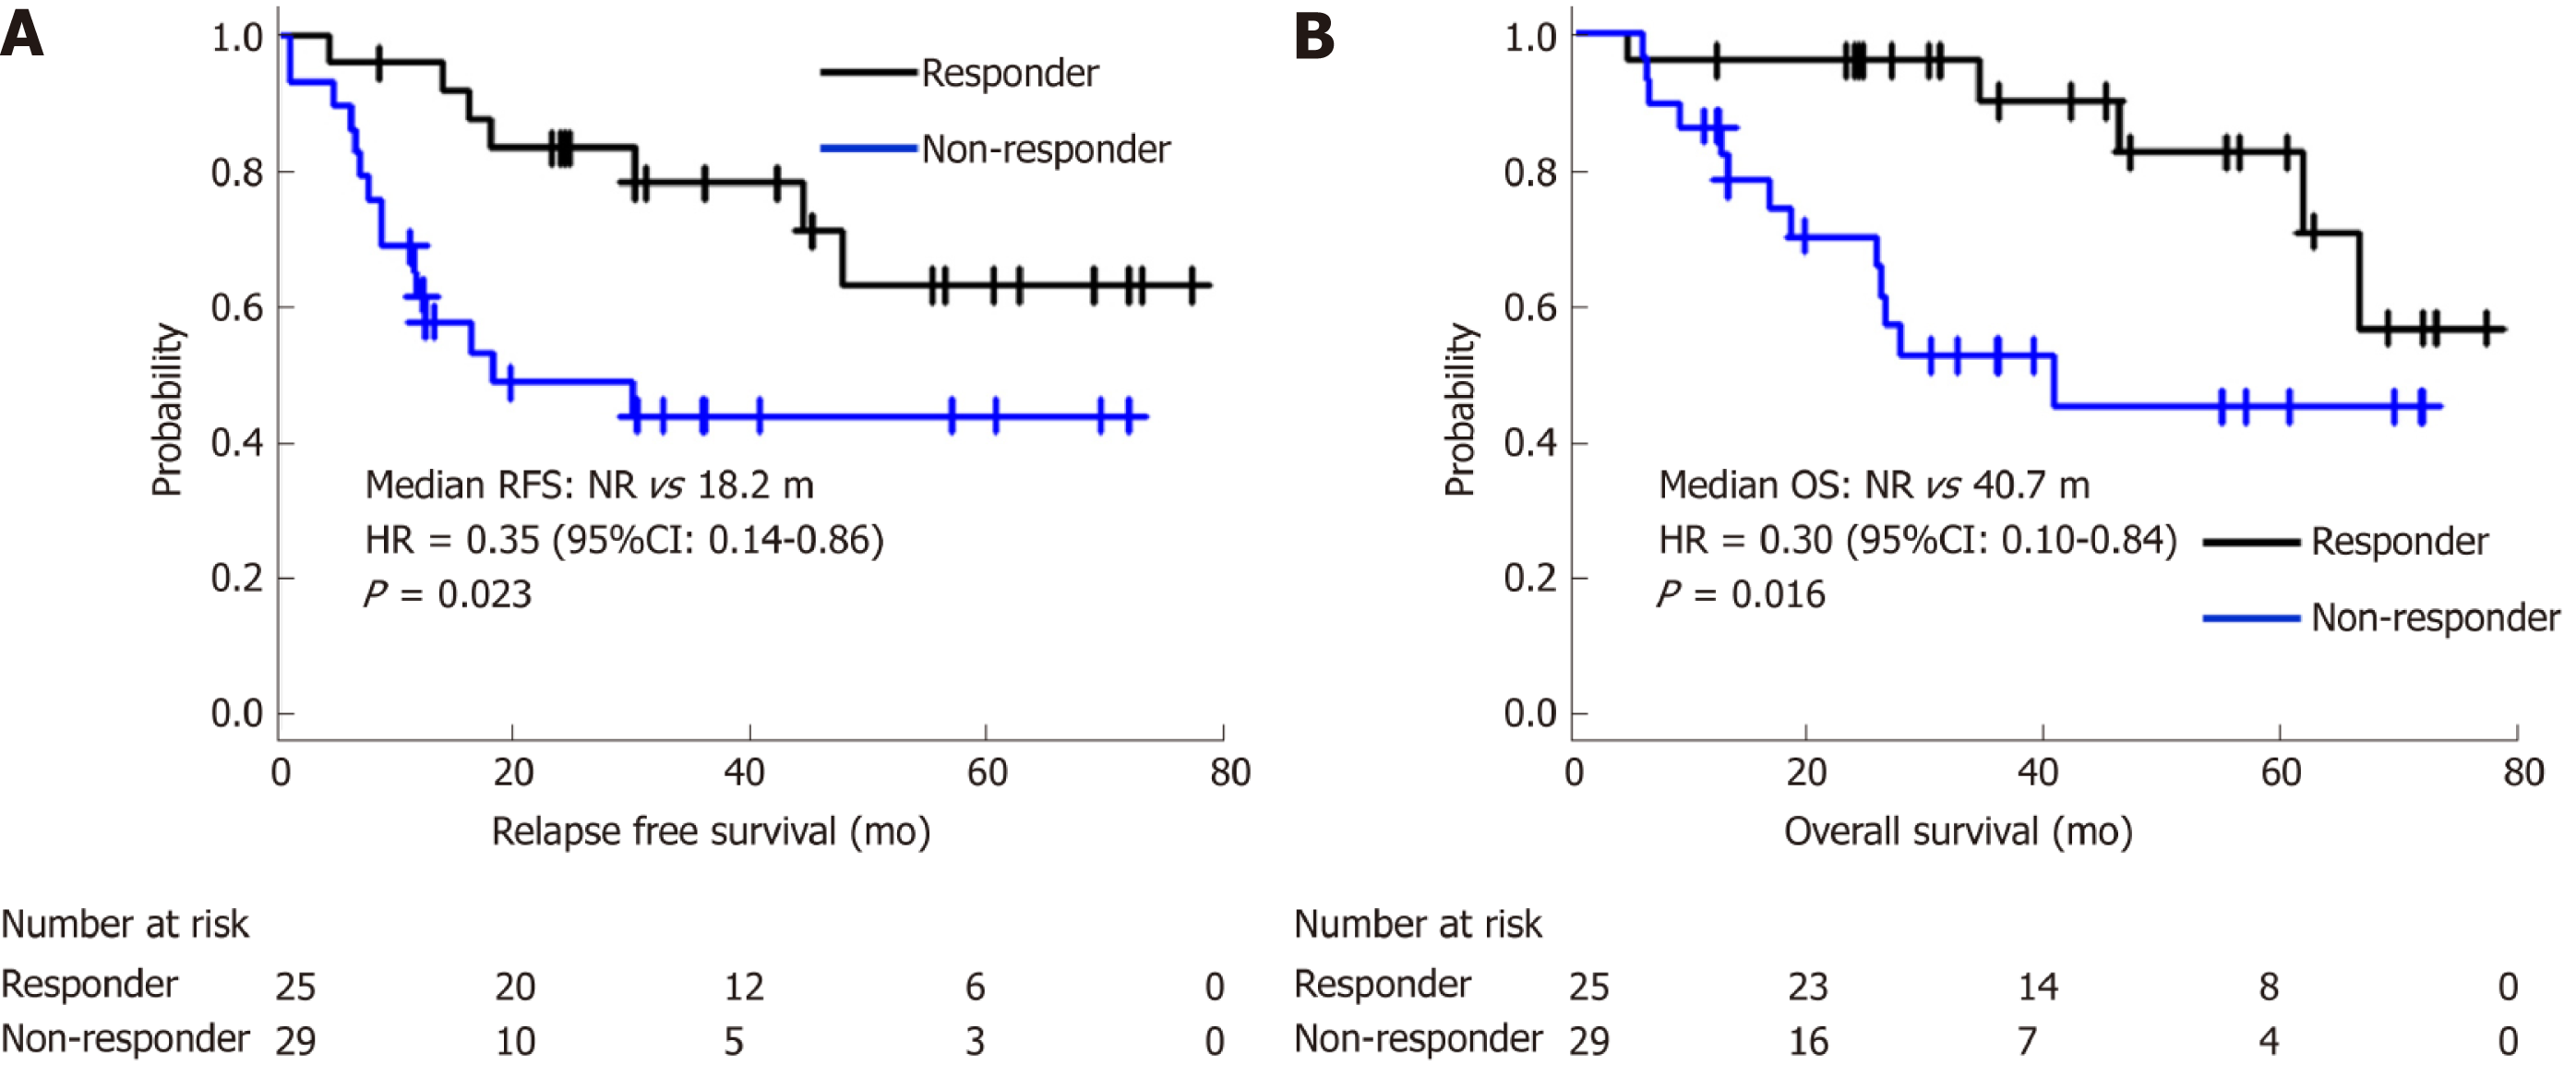
Figure 2 Survival curves of responders and non-responders classified according to pathological response of 10% cut-off evaluated using virtual microscopic slides.
A: Relapse-free survival; B: Overall survival. HR: Hazard ratio; CI: Confidence interval; NR: Not reached; RFS: Relapse-free survival; OS: Overall survival.
- Citation: Kawai S, Shimoda T, Nakajima T, Terashima M, Omae K, Machida N, Yasui H. Pathological response measured using virtual microscopic slides for gastric cancer patients who underwent neoadjuvant chemotherapy. World J Gastroenterol 2019; 25(35): 5334-5343
- URL: https://www.wjgnet.com/1007-9327/full/v25/i35/5334.htm
- DOI: https://dx.doi.org/10.3748/wjg.v25.i35.5334


