Copyright
©The Author(s) 2019.
World J Gastroenterol. Sep 21, 2019; 25(35): 5233-5256
Published online Sep 21, 2019. doi: 10.3748/wjg.v25.i35.5233
Published online Sep 21, 2019. doi: 10.3748/wjg.v25.i35.5233
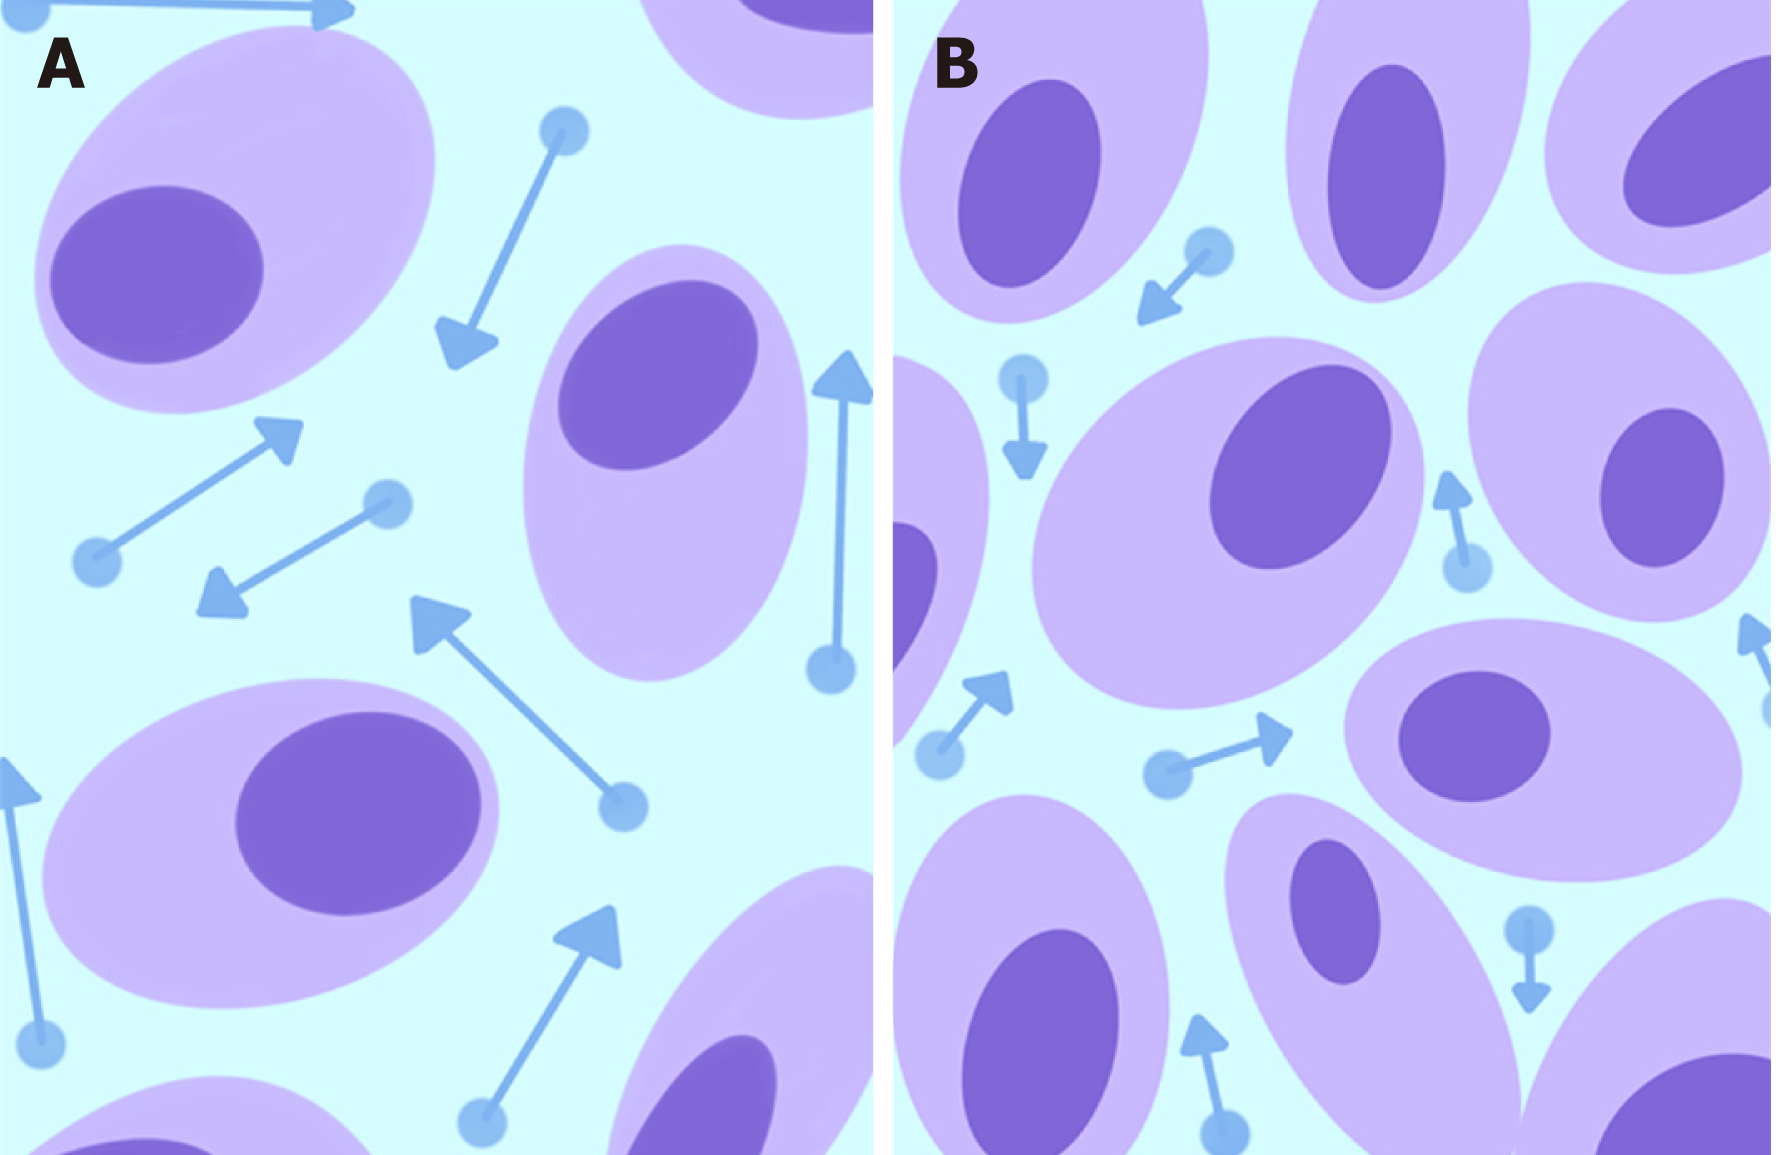
Figure 1 Schematic representation of water molecule diffusion (dots) in the extracellular space.
Normal tissues (A) show a relatively larger extracellular space with high water diffusion (longer arrow vectors higher ADC values), whereas the increased tissue cellularity in a neoplasm (B) reduces the intercellular space and consequently restricts diffusion (shorter arrow vectors lower ADC values).
- Citation: Mainenti PP, Stanzione A, Guarino S, Romeo V, Ugga L, Romano F, Storto G, Maurea S, Brunetti A. Colorectal cancer: Parametric evaluation of morphological, functional and molecular tomographic imaging. World J Gastroenterol 2019; 25(35): 5233-5256
- URL: https://www.wjgnet.com/1007-9327/full/v25/i35/5233.htm
- DOI: https://dx.doi.org/10.3748/wjg.v25.i35.5233


