Copyright
©The Author(s) 2019.
World J Gastroenterol. Sep 7, 2019; 25(33): 4945-4958
Published online Sep 7, 2019. doi: 10.3748/wjg.v25.i33.4945
Published online Sep 7, 2019. doi: 10.3748/wjg.v25.i33.4945
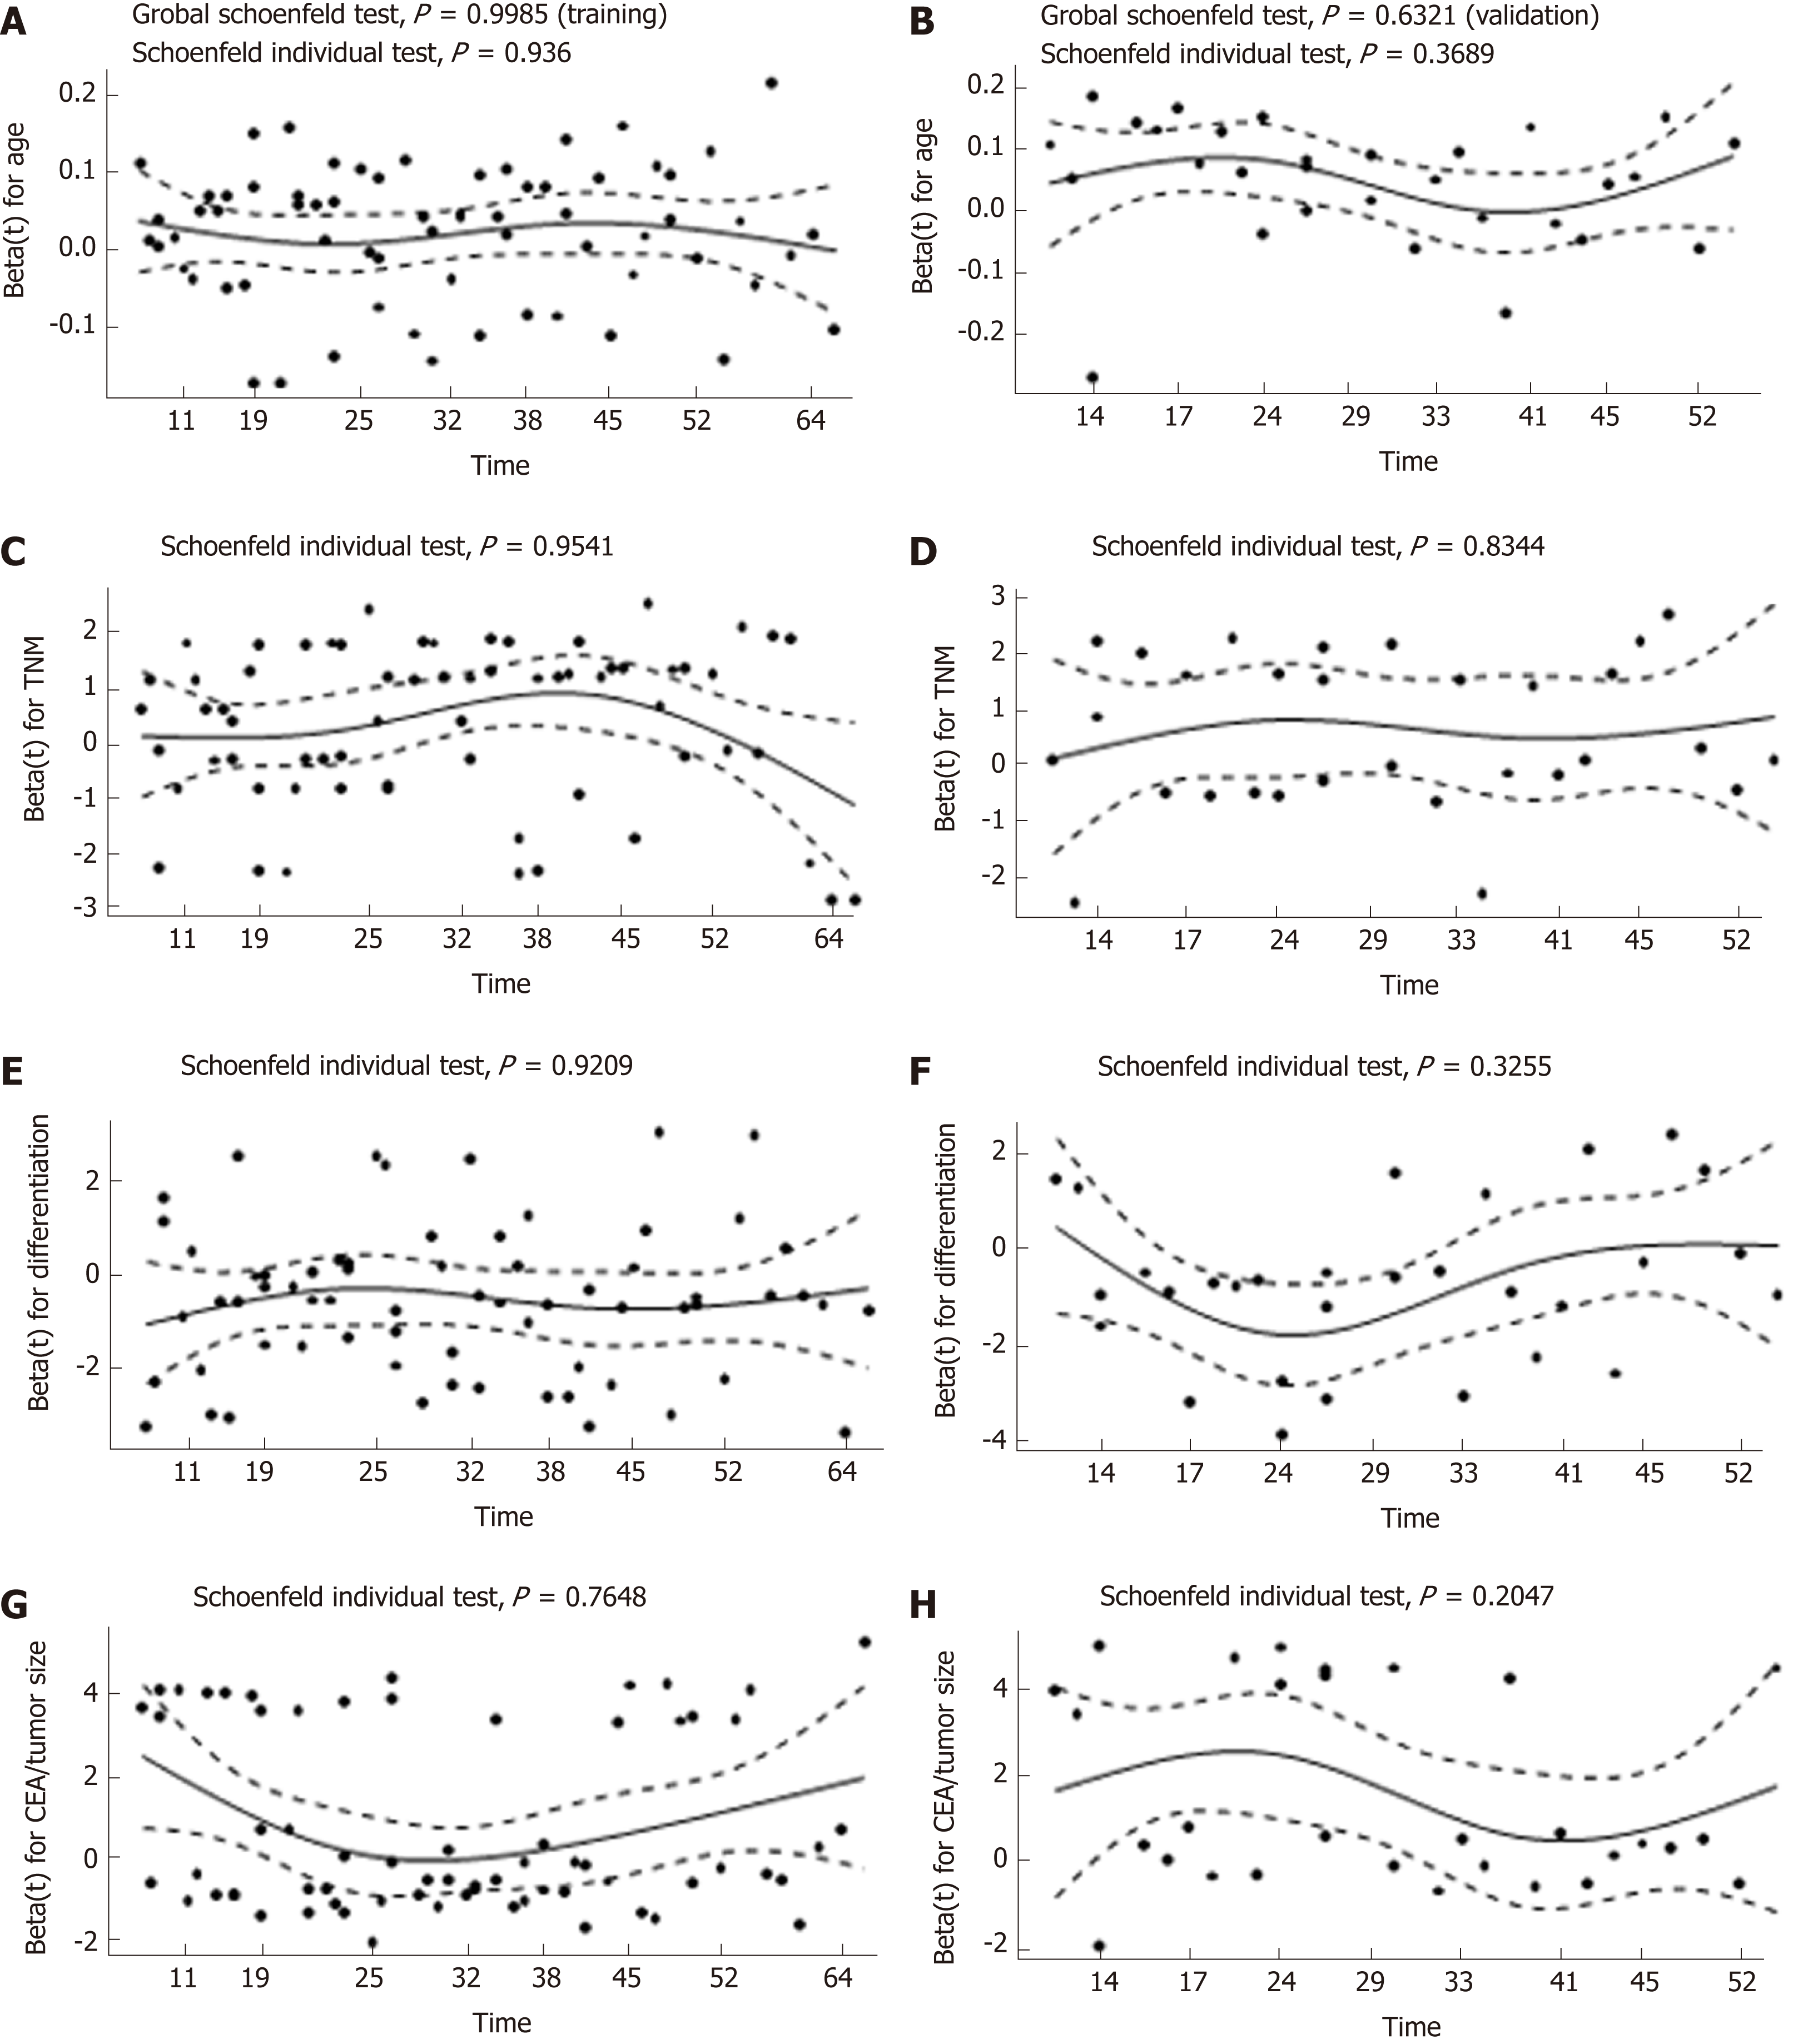
Figure 5 Proportional hazards assumption test for overall survival by plotting the Schoenfeld residuals against time in the training cohort (A, C, E, and G) and the validation cohort (B, D, F, and H).
The X-axis represents the survival time, while the Beta values referring to age, TNM stage, differentiation, and carcinoembryonic antigen/tumor size are shown on the Y-axis. The constant mean of residuals across time confirms that the proportional hazard assumption holds for these covariate with all of the P-values > 0.05. CEA: Carcinoembryonic antigen.
- Citation: Cai D, Huang ZH, Yu HC, Wang XL, Bai LL, Tang GN, Peng SY, Li YJ, Huang MJ, Cao GW, Wang JP, Luo YX. Prognostic value of preoperative carcinoembryonic antigen/tumor size in rectal cancer. World J Gastroenterol 2019; 25(33): 4945-4958
- URL: https://www.wjgnet.com/1007-9327/full/v25/i33/4945.htm
- DOI: https://dx.doi.org/10.3748/wjg.v25.i33.4945


