Copyright
©The Author(s) 2019.
World J Gastroenterol. Sep 7, 2019; 25(33): 4945-4958
Published online Sep 7, 2019. doi: 10.3748/wjg.v25.i33.4945
Published online Sep 7, 2019. doi: 10.3748/wjg.v25.i33.4945
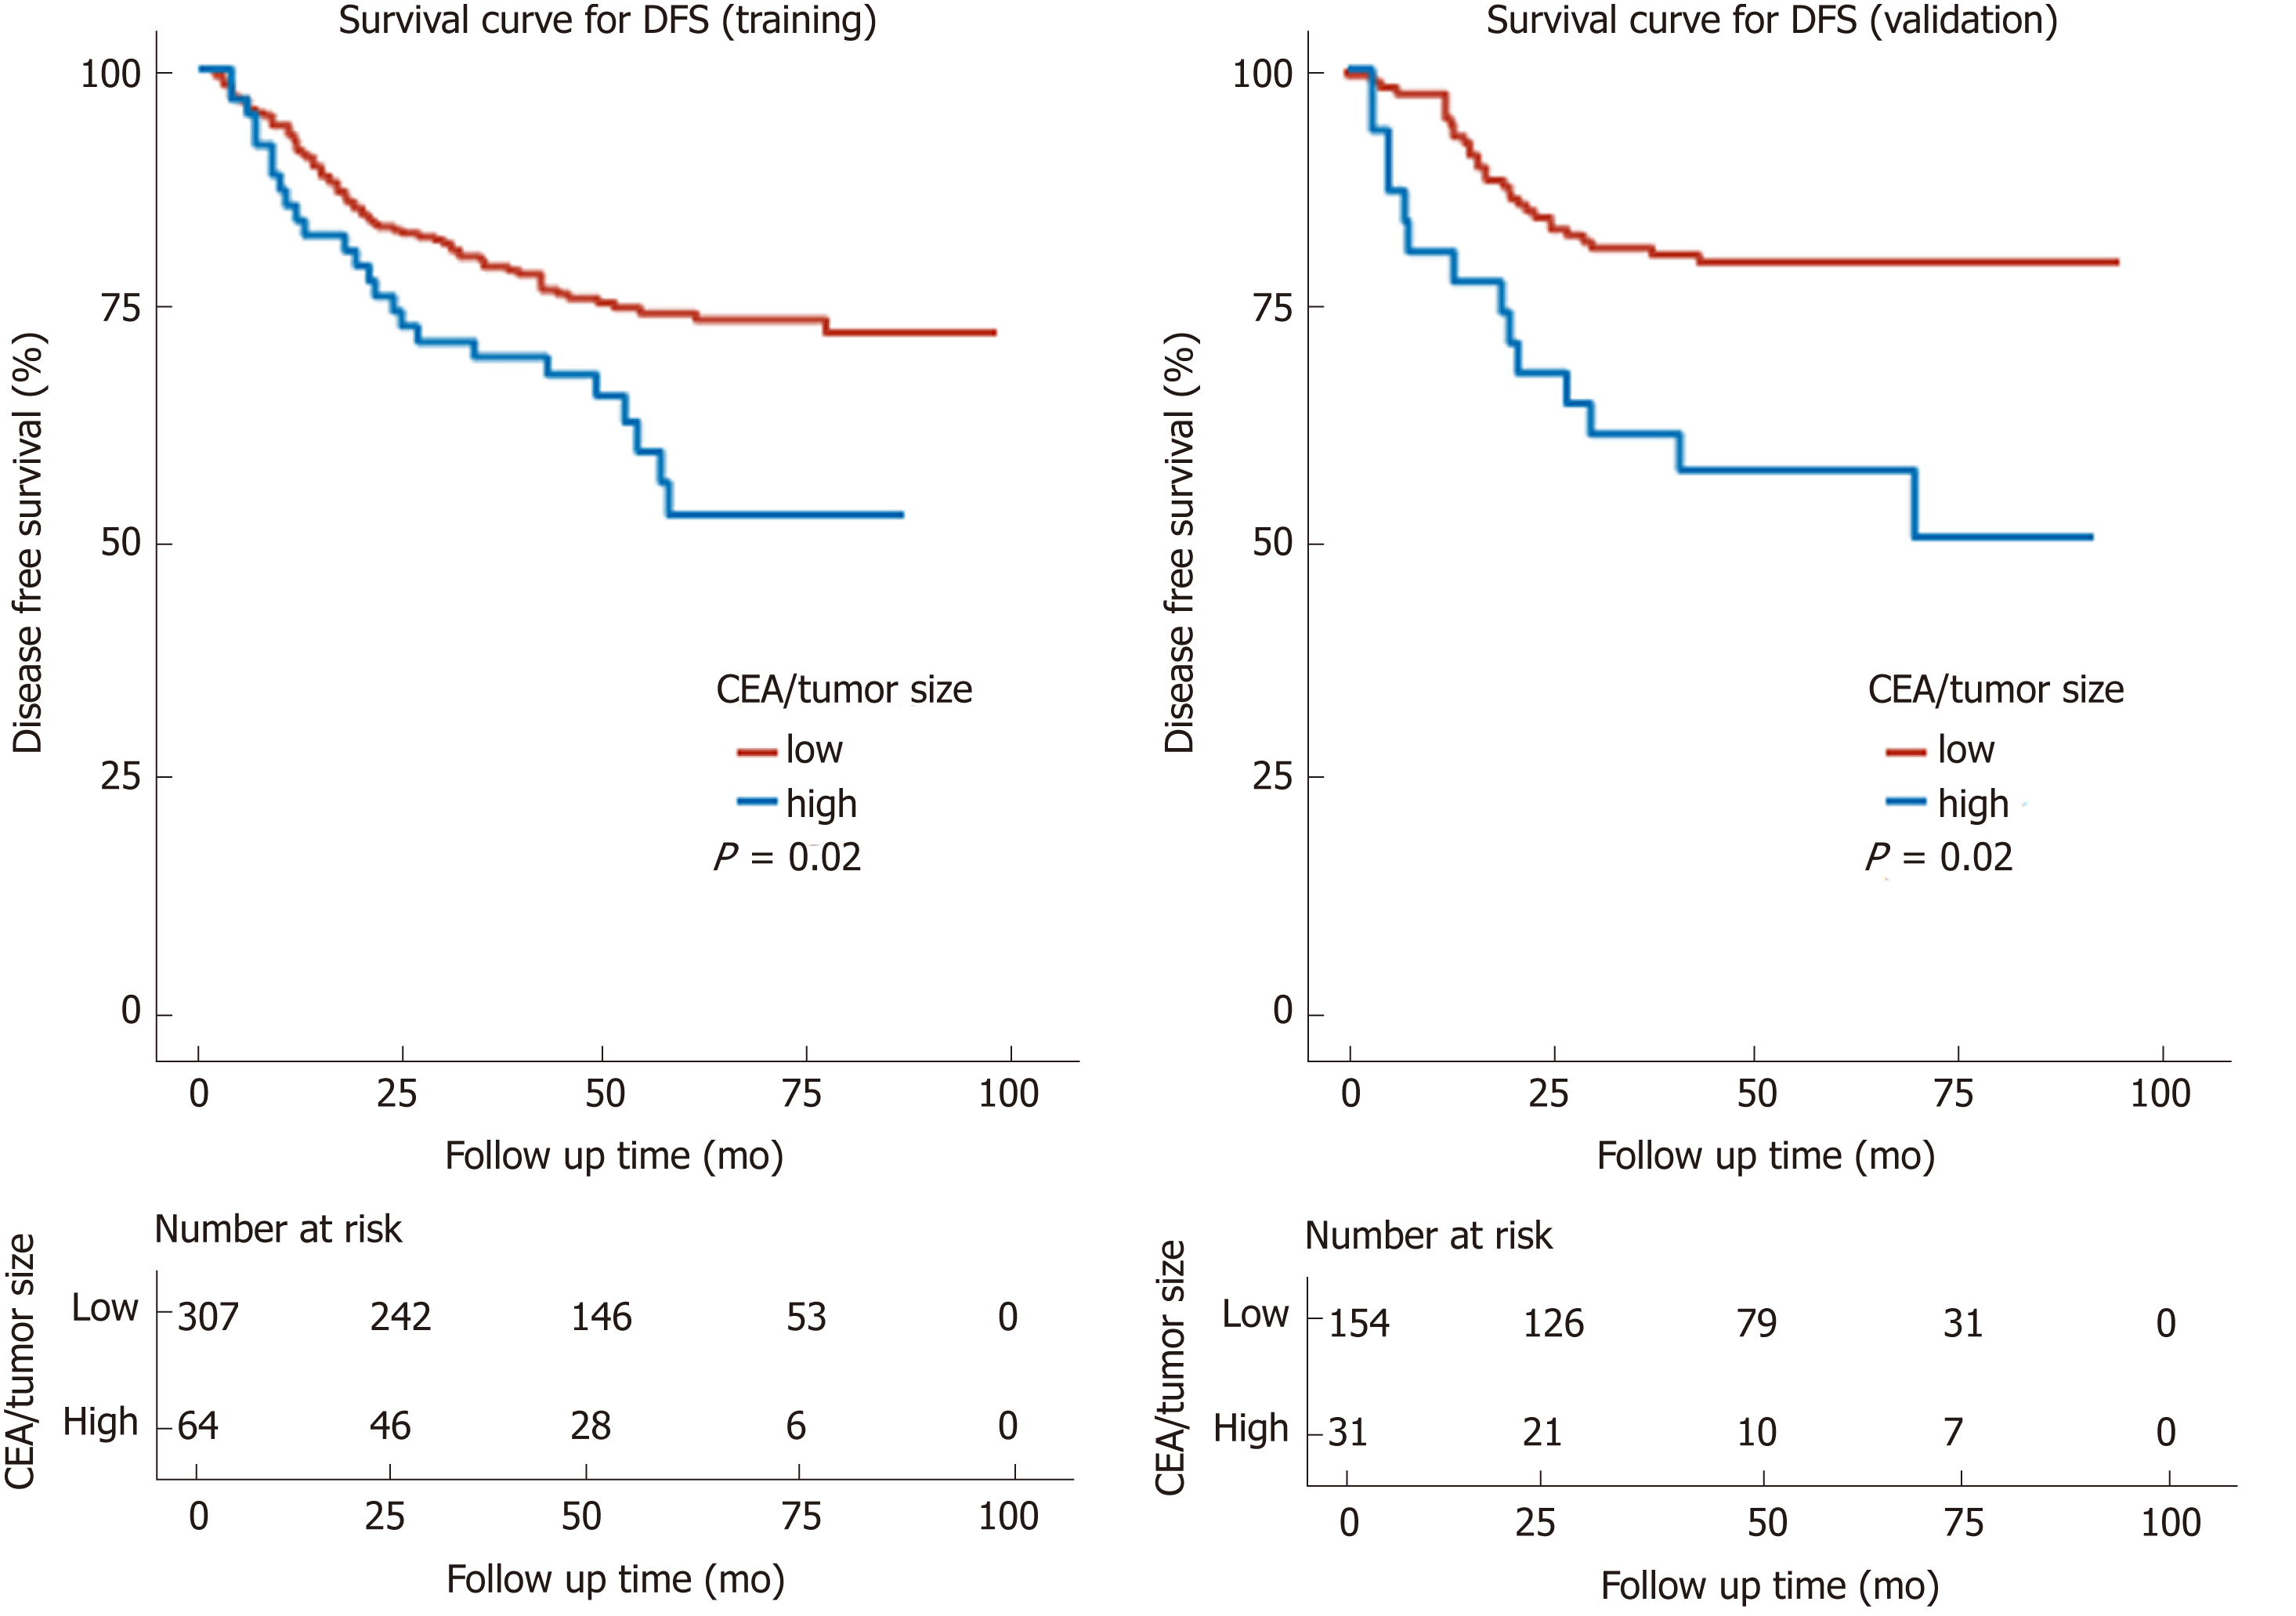
Figure 4 Kaplan-Meier survival curves and risk tables for disease-free survival.
A: Kaplan-Meier survival curves and risk table for disease-free survival (DFS) in the training cohort. The 5-year DFS of the high and low CEA/tumor size groups were 52.5% and 71.9% (P = 0.02), respectively. B: Kaplan-Meier survival curves and risk table for DFS in the validation cohort. The 5-year DFS of the high and low CEA/tumor size groups were 50.3% vs 79.3% (P = 0.002), respectively. The log-rank test was used to calculate the P-value. DFS: Disease-free survival; CEA: Carcinoembryonic antigen.
- Citation: Cai D, Huang ZH, Yu HC, Wang XL, Bai LL, Tang GN, Peng SY, Li YJ, Huang MJ, Cao GW, Wang JP, Luo YX. Prognostic value of preoperative carcinoembryonic antigen/tumor size in rectal cancer. World J Gastroenterol 2019; 25(33): 4945-4958
- URL: https://www.wjgnet.com/1007-9327/full/v25/i33/4945.htm
- DOI: https://dx.doi.org/10.3748/wjg.v25.i33.4945


