Copyright
©The Author(s) 2019.
World J Gastroenterol. Sep 7, 2019; 25(33): 4892-4903
Published online Sep 7, 2019. doi: 10.3748/wjg.v25.i33.4892
Published online Sep 7, 2019. doi: 10.3748/wjg.v25.i33.4892
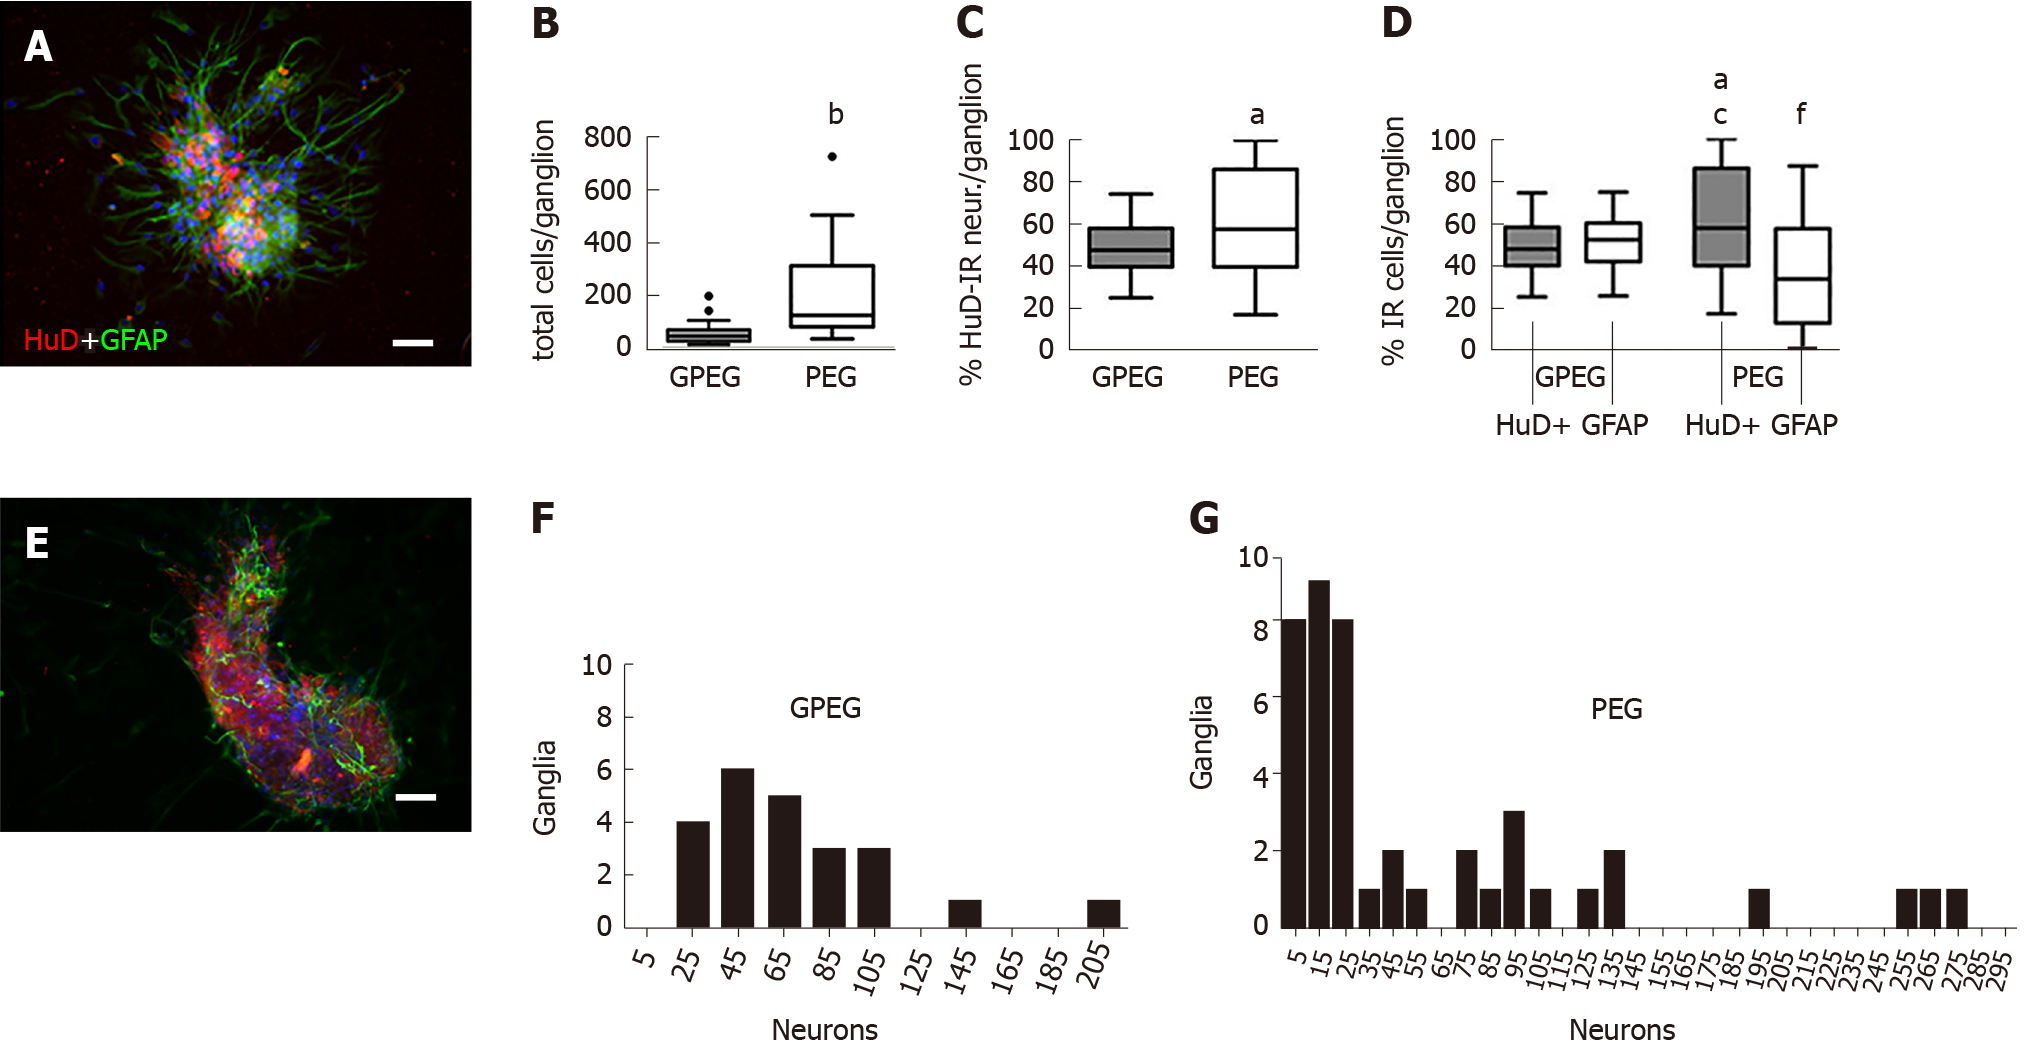
Figure 1 Descriptive analysis of the morphology and cellular composition of guinea pig and pig enteric ganglia after 2 d in vitro.
A and E: Representative photomicrographs of guinea pig enteric ganglia (GPEG) and pig enteric ganglia (PEG) stained with HuD (red) and glial fibrillary acidic protein (GFAP) (green) antibodies directed to neurons and glial cells respectively (scale bar: 100 µm); B: Total number of cells per ganglion in GPEG, left gray box plot, and PEG, right white bars, cultures (53.3 ± 5.2 vs 213.7 ± 50.4 neurons per ganglion, bP < 0.001 vs GPEG); C: PEG showed a higher number of HuD-immunoreactive (HuD-IR) neurons compared to GPEG (+13.7%, aP < 0.05); D: PEG and GPEG comparison of HuD-IR neurons and GFAP-immunoreactive (GFAP-IR) glial cells: PEG presented a higher number of HuD-IR neurons compared to GFAP-IR glial cells (+28.4%, aP < 0.05). In comparison to GPEG, PEG showed a higher number of neurons (+12.7%, cP < 0.05) and a lower number of GFAP-IR glial cells (-15.7%, fP < 0.01); B-D: Values reported as Tukey box-plots were obtained by three independent experiments. F and G: Frequency analysis indicating the number of GPEG (F) and PEG (G) presenting 5 to 205 neurons. GPEG: Guinea pig enteric ganglia; PEG: Pig enteric ganglia; GFAP: Glial fibrillary acidic protein; GFAP-IR: Glial fibrillary acidic protein-immunoreactive; HuD-IR: HuD-immunoreactive.
- Citation: Dothel G, Bernardini C, Zannoni A, Spirito MR, Salaroli R, Bacci ML, Forni M, Ponti FD. Ex vivo effect of vascular wall stromal cells secretome on enteric ganglia. World J Gastroenterol 2019; 25(33): 4892-4903
- URL: https://www.wjgnet.com/1007-9327/full/v25/i33/4892.htm
- DOI: https://dx.doi.org/10.3748/wjg.v25.i33.4892


