Copyright
©The Author(s) 2019.
World J Gastroenterol. Aug 28, 2019; 25(32): 4727-4738
Published online Aug 28, 2019. doi: 10.3748/wjg.v25.i32.4727
Published online Aug 28, 2019. doi: 10.3748/wjg.v25.i32.4727
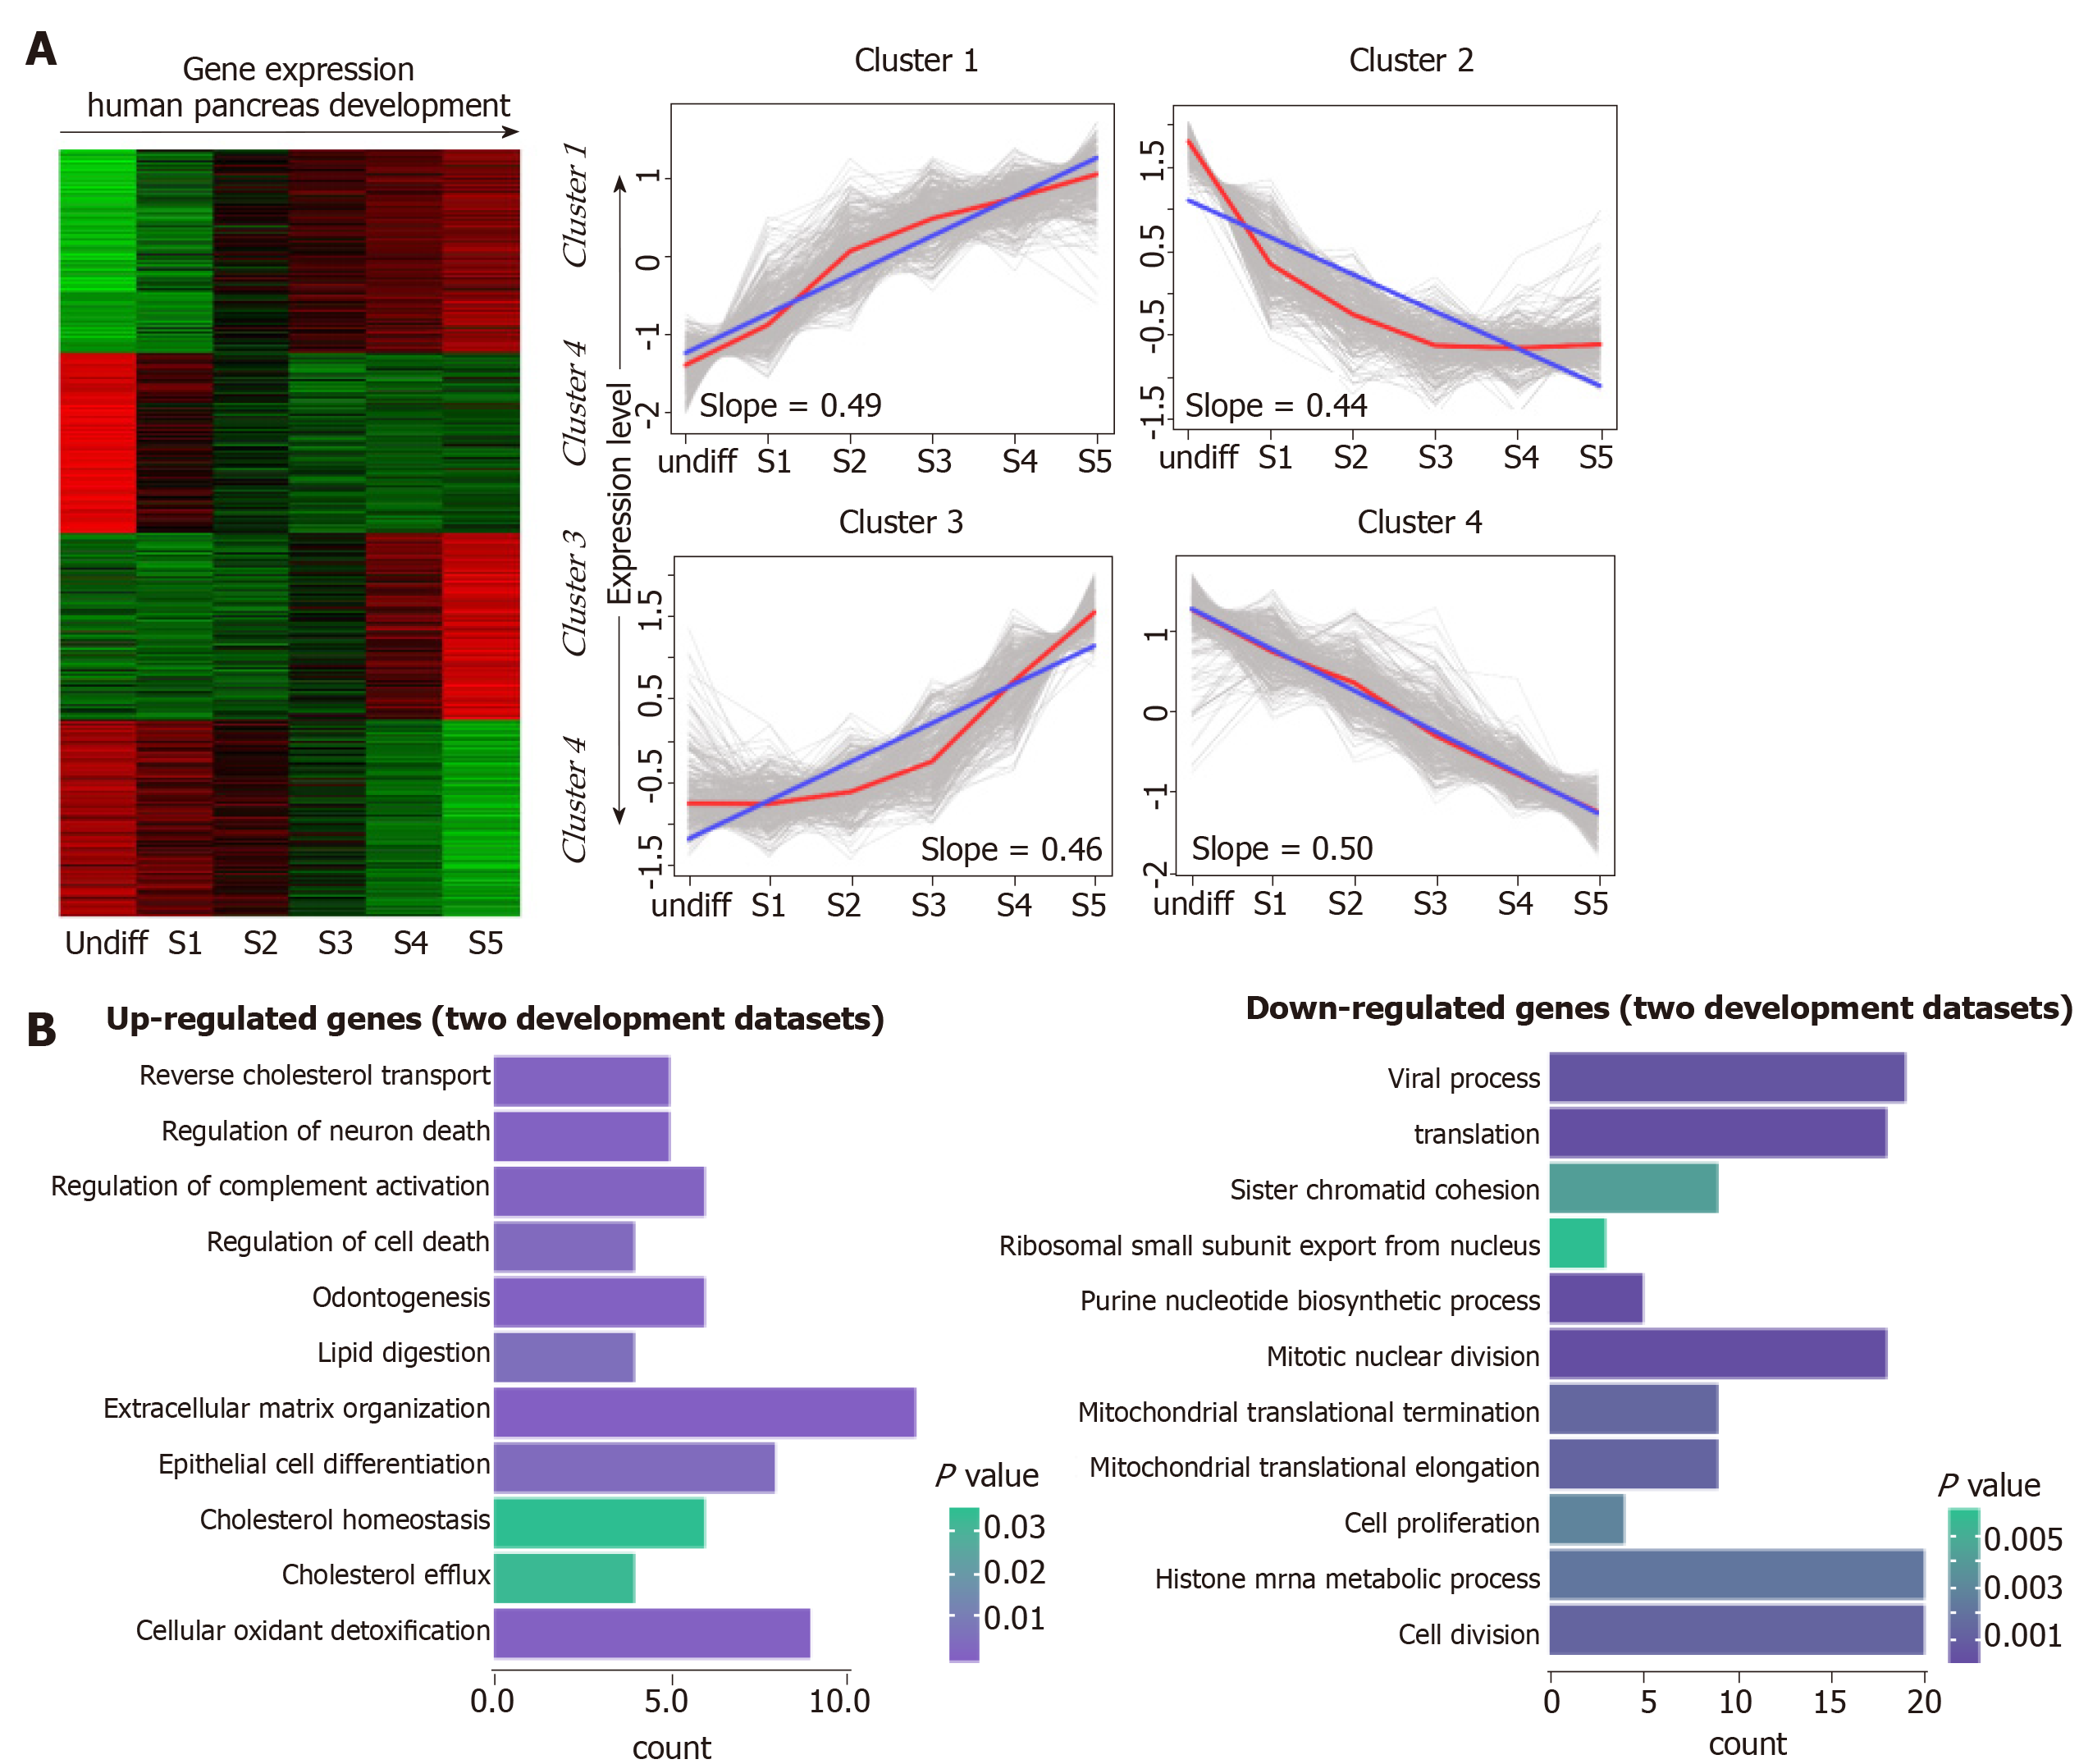
Figure 1 Continuous differential expression patterns in pancreas development.
A: Clustering of human pancreas development genes. In the heat map, green indicates down-regulated, and red indicates up-regulated. In the line graphs, lines represent the tendency of the cluster changes; B: Gene Ontology-Biological Process annotations of the continuously up- and down-regulated genes.
- Citation: Zang HL, Huang GM, Ju HY, Tian XF. Integrative analysis of the inverse expression patterns in pancreas development and cancer progression. World J Gastroenterol 2019; 25(32): 4727-4738
- URL: https://www.wjgnet.com/1007-9327/full/v25/i32/4727.htm
- DOI: https://dx.doi.org/10.3748/wjg.v25.i32.4727


