Copyright
©The Author(s) 2019.
World J Gastroenterol. Aug 28, 2019; 25(32): 4661-4672
Published online Aug 28, 2019. doi: 10.3748/wjg.v25.i32.4661
Published online Aug 28, 2019. doi: 10.3748/wjg.v25.i32.4661
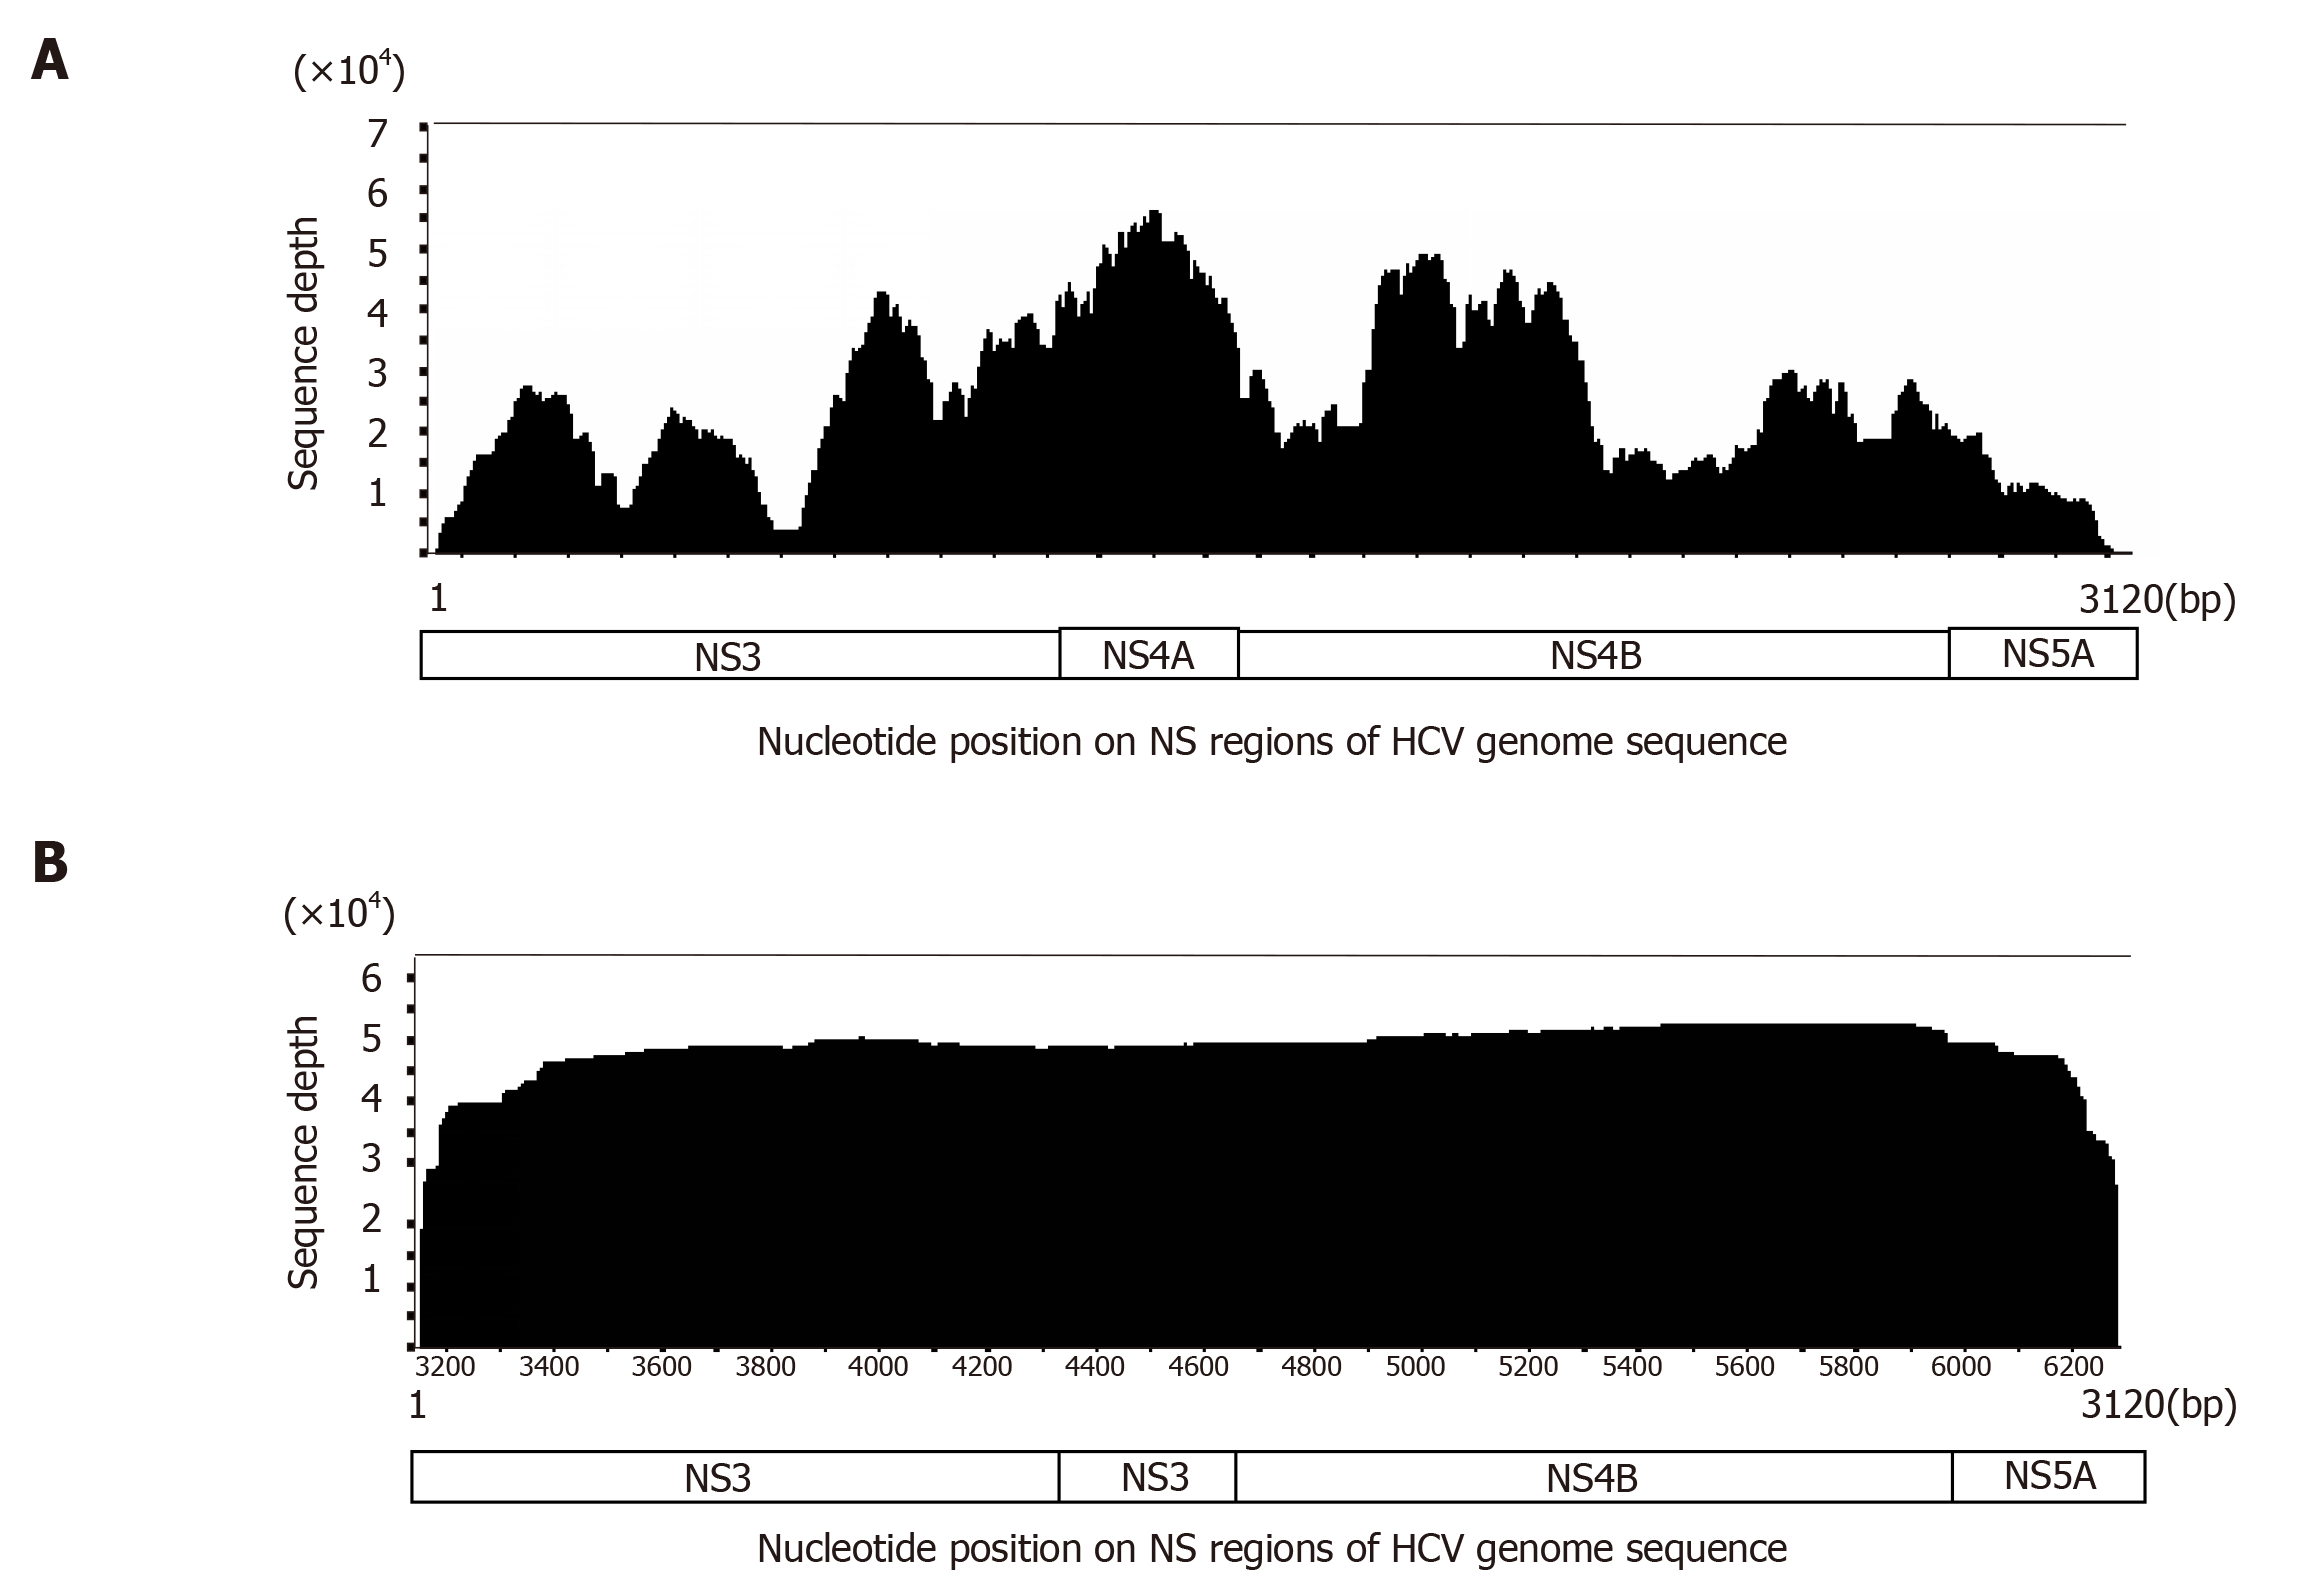
Figure 3 Comparison of coverage curves generated by short-read next-generation sequencing and long-read single-molecular real-time sequencing.
A: A coverage curve generated by an IonProton sequencer. Approximately 3120 bp from the NS3 to NS5A region of the hepatitis C virus (HCV) genome from an HCV-infected patient was amplified and long-PCR products were subjected to short-read sequencing. The sequencing depth varies according to genomic location; B: When the same template was sequenced using PacBio RSII sequencer, the coverage curve demonstrates uniform coverage through the NS3 to NS5A regions. HCV: Hepatitis C virus.
- Citation: Takeda H, Yamashita T, Ueda Y, Sekine A. Exploring the hepatitis C virus genome using single molecule real-time sequencing. World J Gastroenterol 2019; 25(32): 4661-4672
- URL: https://www.wjgnet.com/1007-9327/full/v25/i32/4661.htm
- DOI: https://dx.doi.org/10.3748/wjg.v25.i32.4661


