Copyright
©The Author(s) 2019.
World J Gastroenterol. Aug 21, 2019; 25(31): 4452-4467
Published online Aug 21, 2019. doi: 10.3748/wjg.v25.i31.4452
Published online Aug 21, 2019. doi: 10.3748/wjg.v25.i31.4452
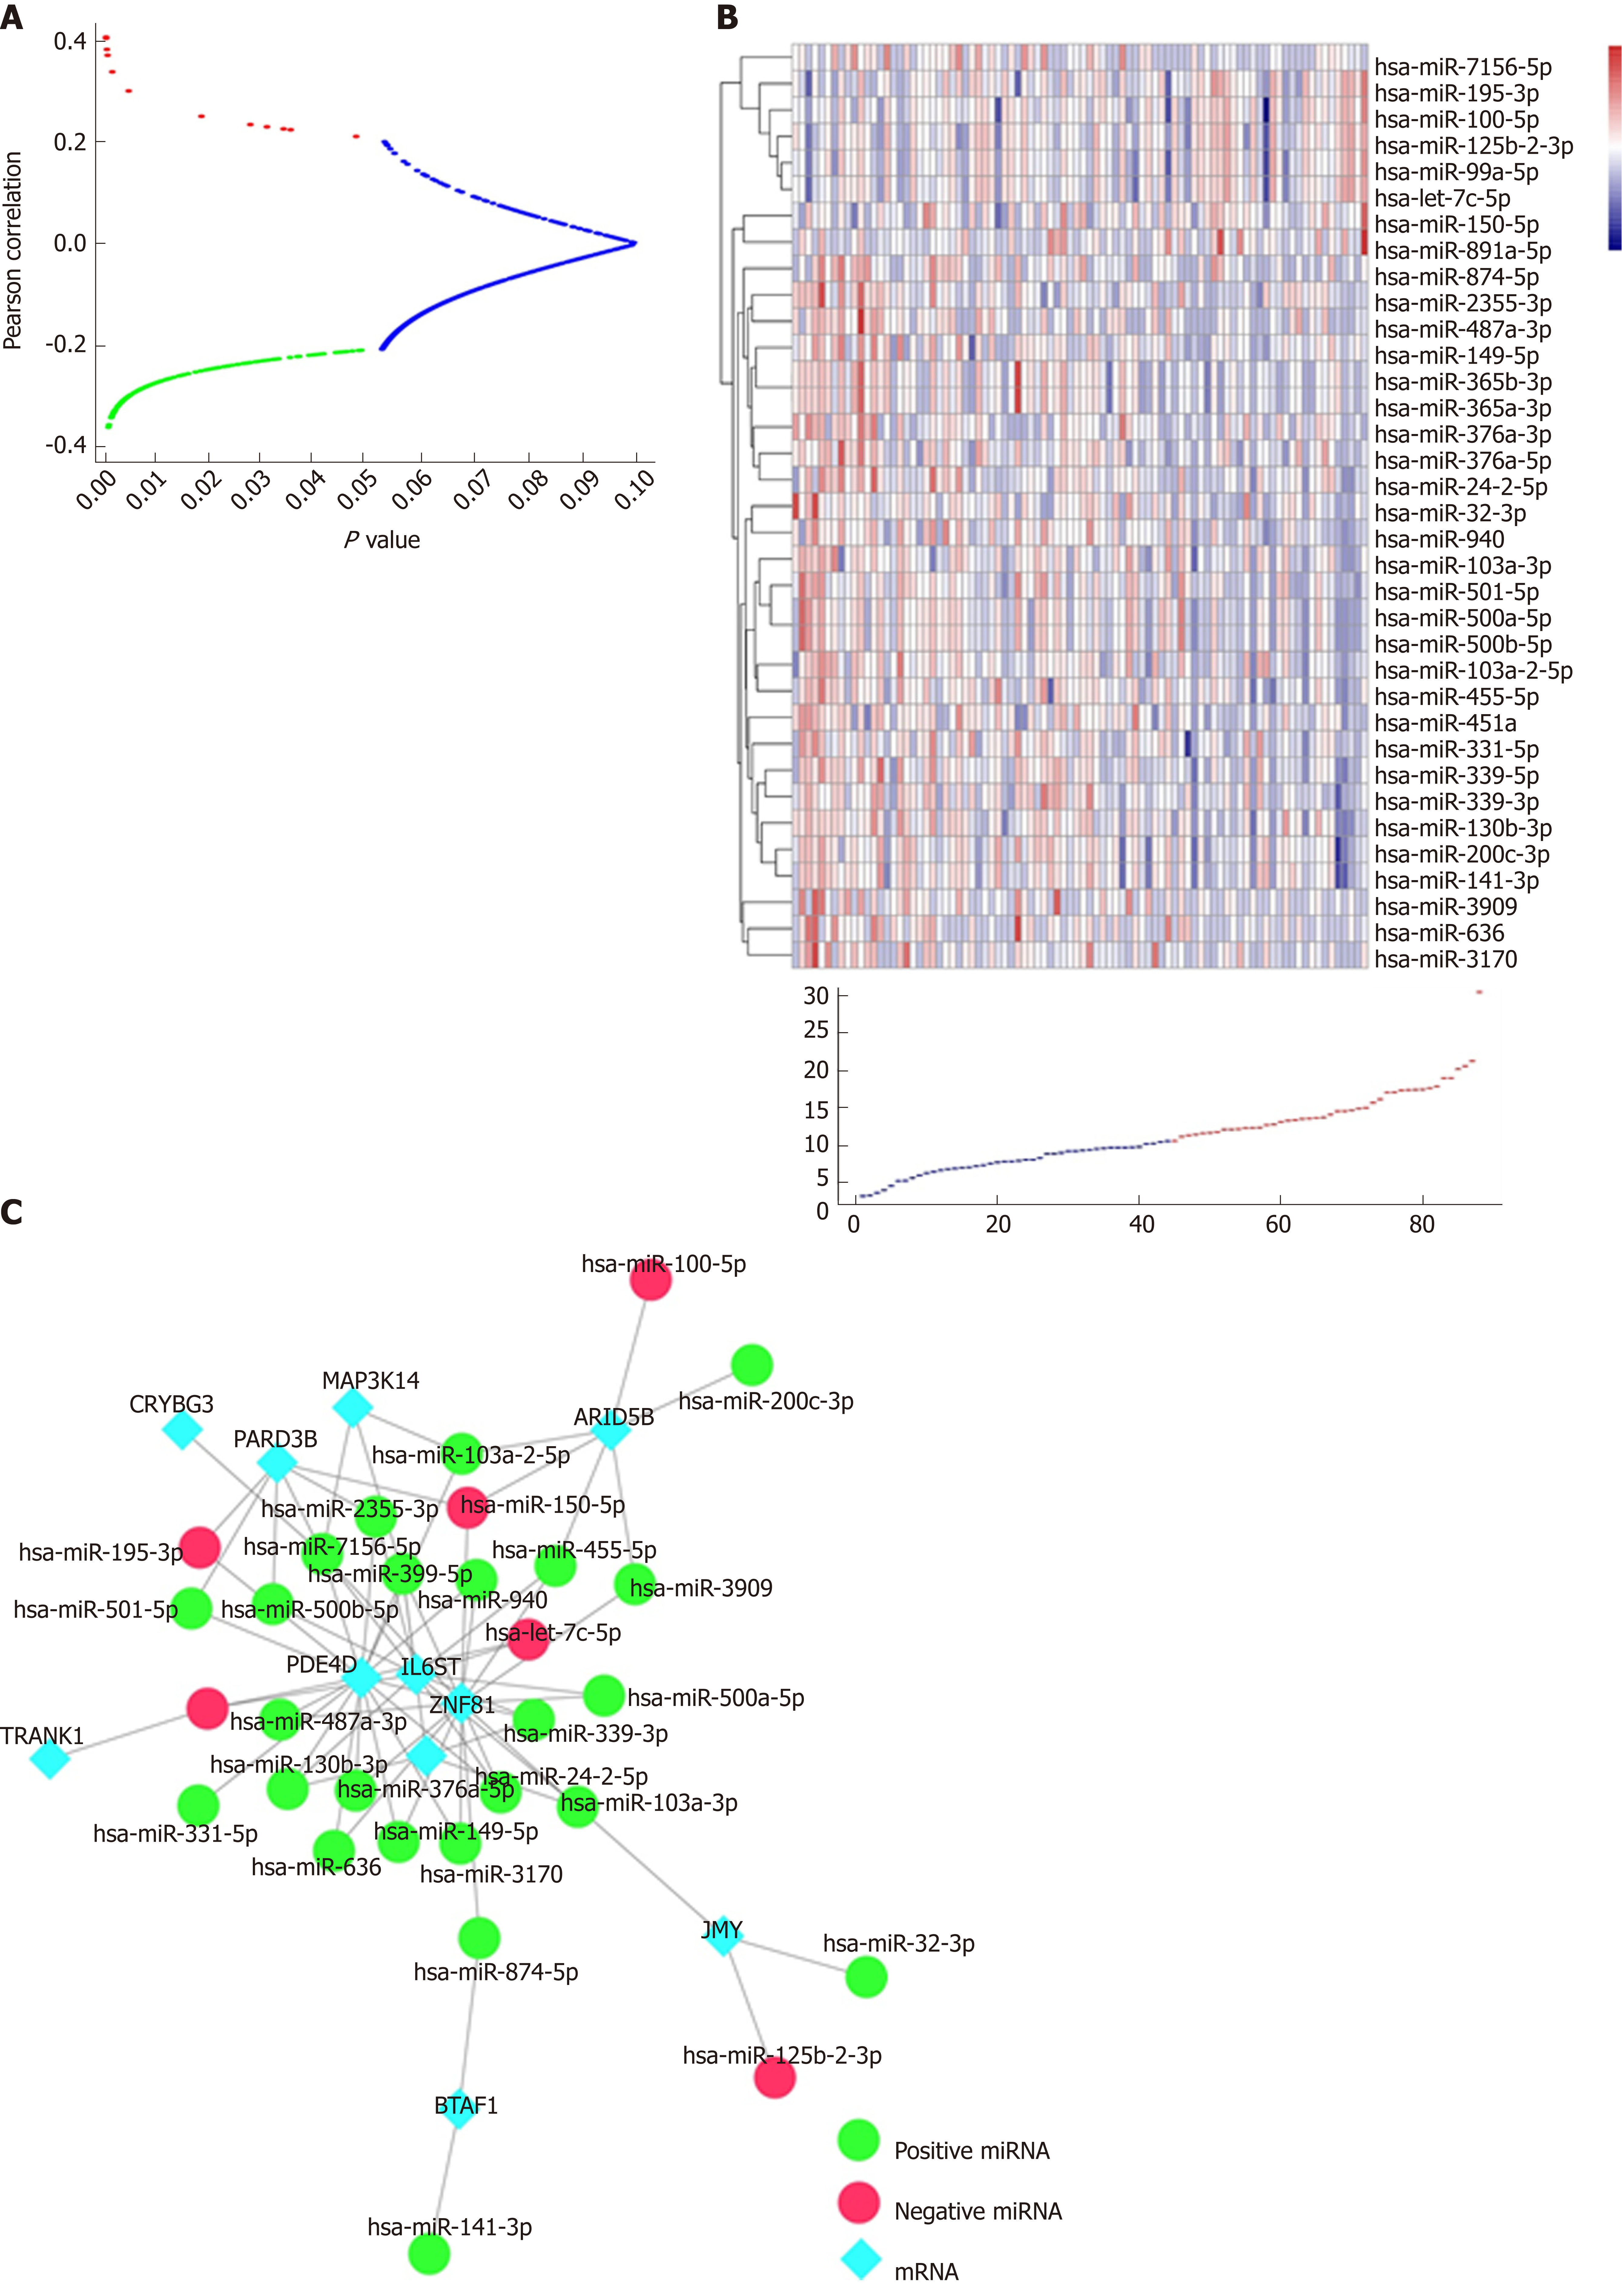
Figure 4 Genome-wide analysis of miRNAs associated with APChigh.
A: Relationship between the correlation coefficient and correlation P-value; B: MiRNAs that were significantly positively correlated (red), negatively correlated (green), and had no correlation (blue) with APChigh, as well as the heatmap of miRNAs associated with APChigh; C: mRNA-miRNA regulatory network. APC: Adenoma polyposis coli.
- Citation: Du WB, Lin CH, Chen WB. High expression of APC is an unfavorable prognostic biomarker in T4 gastric cancer patients. World J Gastroenterol 2019; 25(31): 4452-4467
- URL: https://www.wjgnet.com/1007-9327/full/v25/i31/4452.htm
- DOI: https://dx.doi.org/10.3748/wjg.v25.i31.4452


