Copyright
©The Author(s) 2019.
World J Gastroenterol. Jan 21, 2019; 25(3): 367-377
Published online Jan 21, 2019. doi: 10.3748/wjg.v25.i3.367
Published online Jan 21, 2019. doi: 10.3748/wjg.v25.i3.367
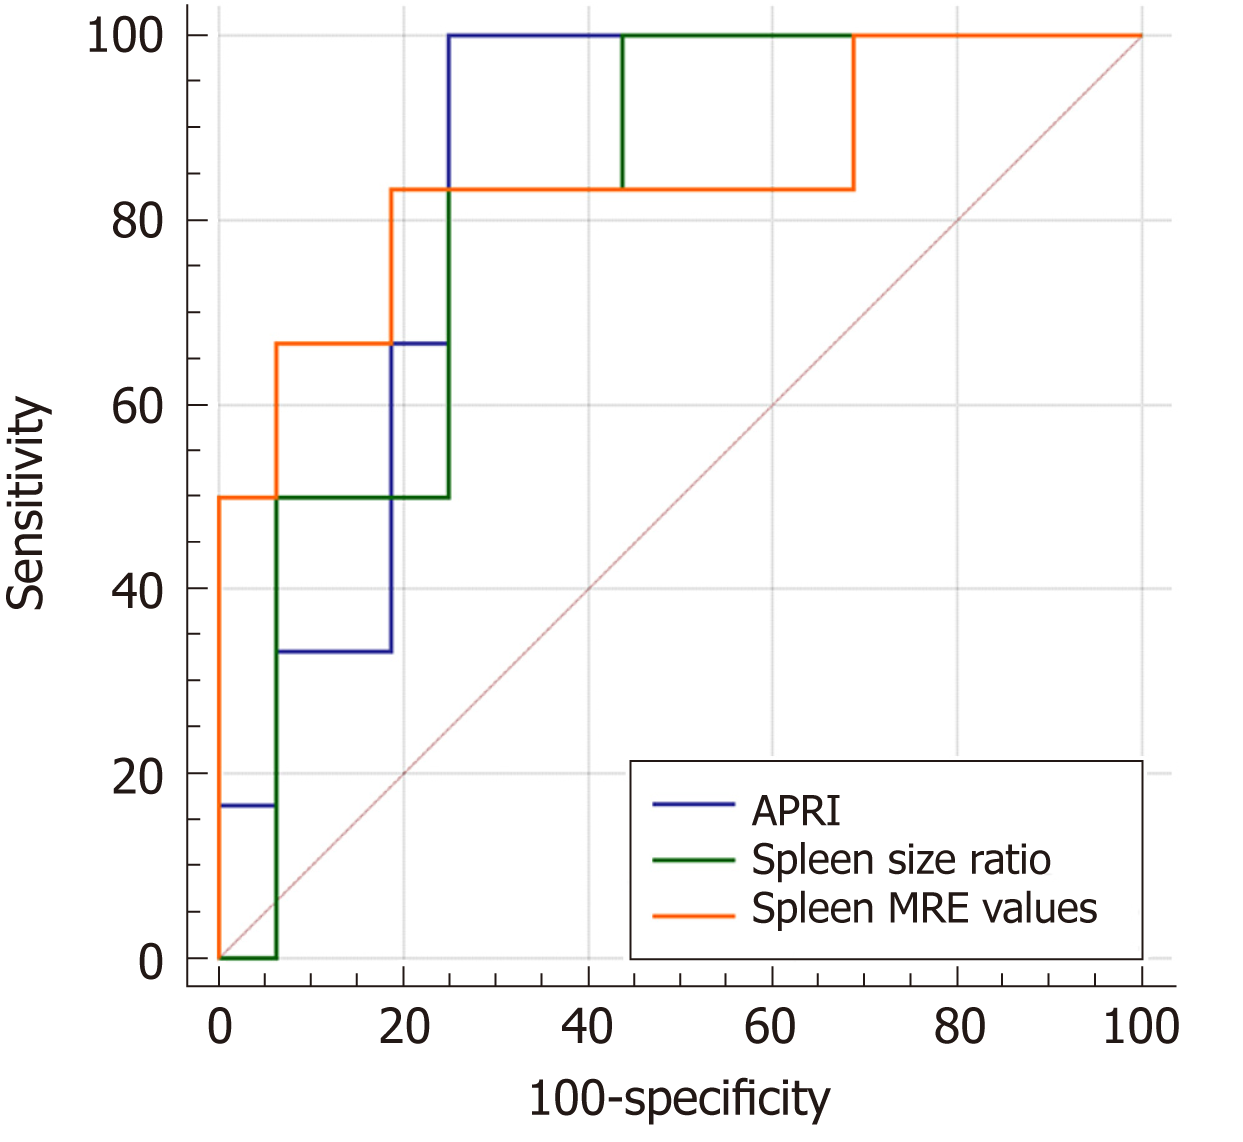
Figure 3 Comparison of area under the curve analyses for predicting varices.
The area under the curve was 0.844 for the aspartate aminotransferase to platelet ratio index (cut-off, 0.65), 0.813 for the spleen size ratio (cut-off, 1.08) and 0.844 for the spleen magnetic resonance elastography values (cut-off, 9.9 kPa) for predicting gastroesophageal varices. The diagnostic performance did not differ among these three methods. APRI: Aspartate aminotransferase to platelet ratio index.
- Citation: Yoon H, Shin HJ, Kim MJ, Han SJ, Koh H, Kim S, Lee MJ. Predicting gastroesophageal varices through spleen magnetic resonance elastography in pediatric liver fibrosis. World J Gastroenterol 2019; 25(3): 367-377
- URL: https://www.wjgnet.com/1007-9327/full/v25/i3/367.htm
- DOI: https://dx.doi.org/10.3748/wjg.v25.i3.367


