Copyright
©The Author(s) 2019.
World J Gastroenterol. Jan 21, 2019; 25(3): 367-377
Published online Jan 21, 2019. doi: 10.3748/wjg.v25.i3.367
Published online Jan 21, 2019. doi: 10.3748/wjg.v25.i3.367
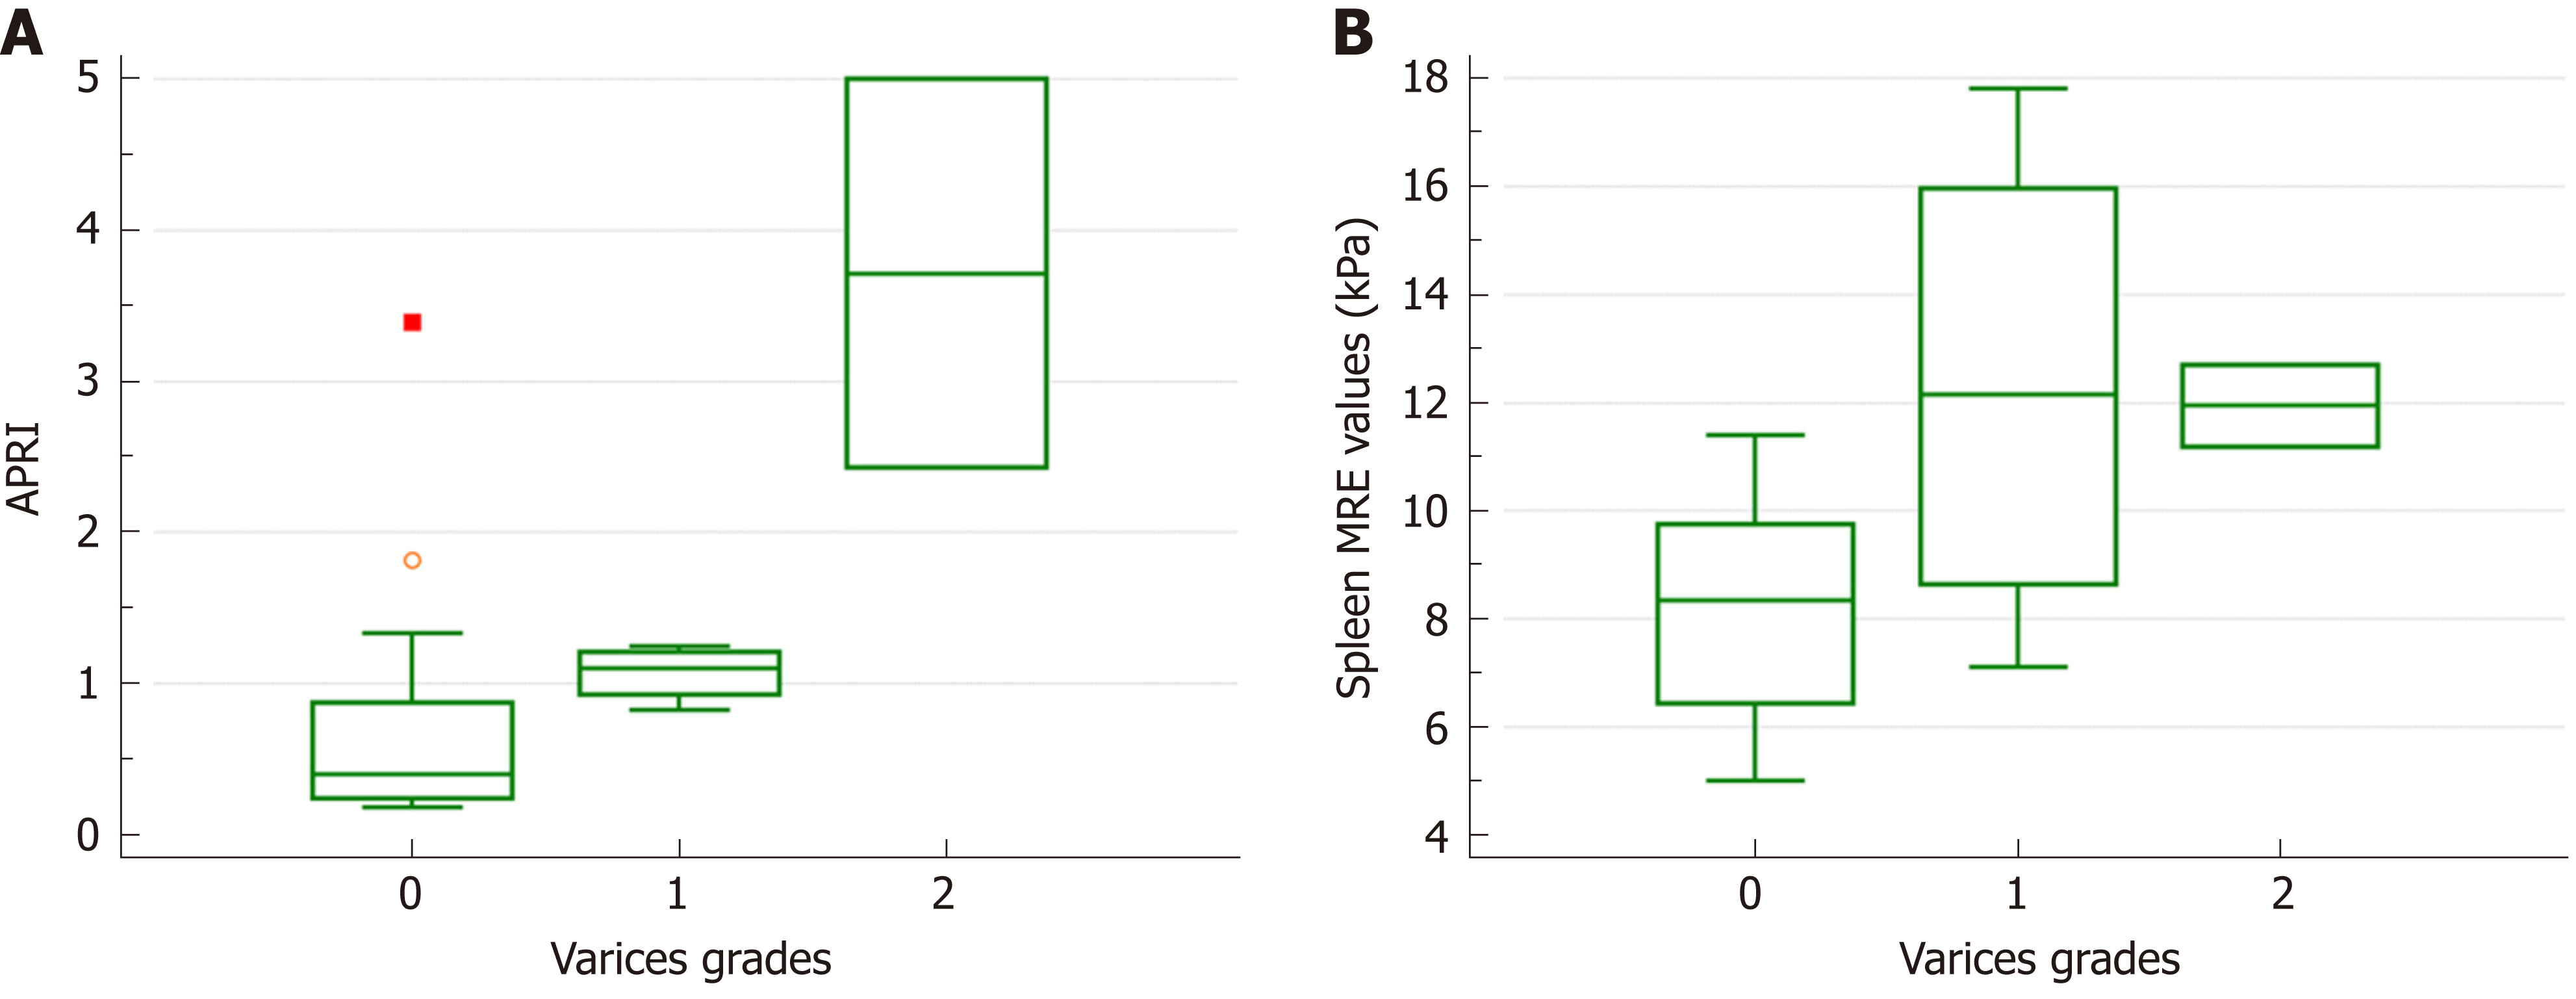
Figure 1 Box-and-whisker plots for the comparison of varices grades.
The graphs are shown for (A) the aspartate aminotransferase to platelet ratio index (APRI) and (B) spleen magnetic resonance elastography (MRE) values according to the grade of gastroesophageal varices. Among the different varices grades, there were significant differences in the APRI (P = 0.029) and spleen MRE values (P = 0.045), but not in the spleen size ratio (P = 0.084) or liver MRE values (P = 0.795). MRE: Magnetic resonance elastography; APRI: Aspartate aminotransferase to platelet ratio index.
- Citation: Yoon H, Shin HJ, Kim MJ, Han SJ, Koh H, Kim S, Lee MJ. Predicting gastroesophageal varices through spleen magnetic resonance elastography in pediatric liver fibrosis. World J Gastroenterol 2019; 25(3): 367-377
- URL: https://www.wjgnet.com/1007-9327/full/v25/i3/367.htm
- DOI: https://dx.doi.org/10.3748/wjg.v25.i3.367


