Copyright
©The Author(s) 2019.
World J Gastroenterol. Aug 7, 2019; 25(29): 3985-3995
Published online Aug 7, 2019. doi: 10.3748/wjg.v25.i29.3985
Published online Aug 7, 2019. doi: 10.3748/wjg.v25.i29.3985
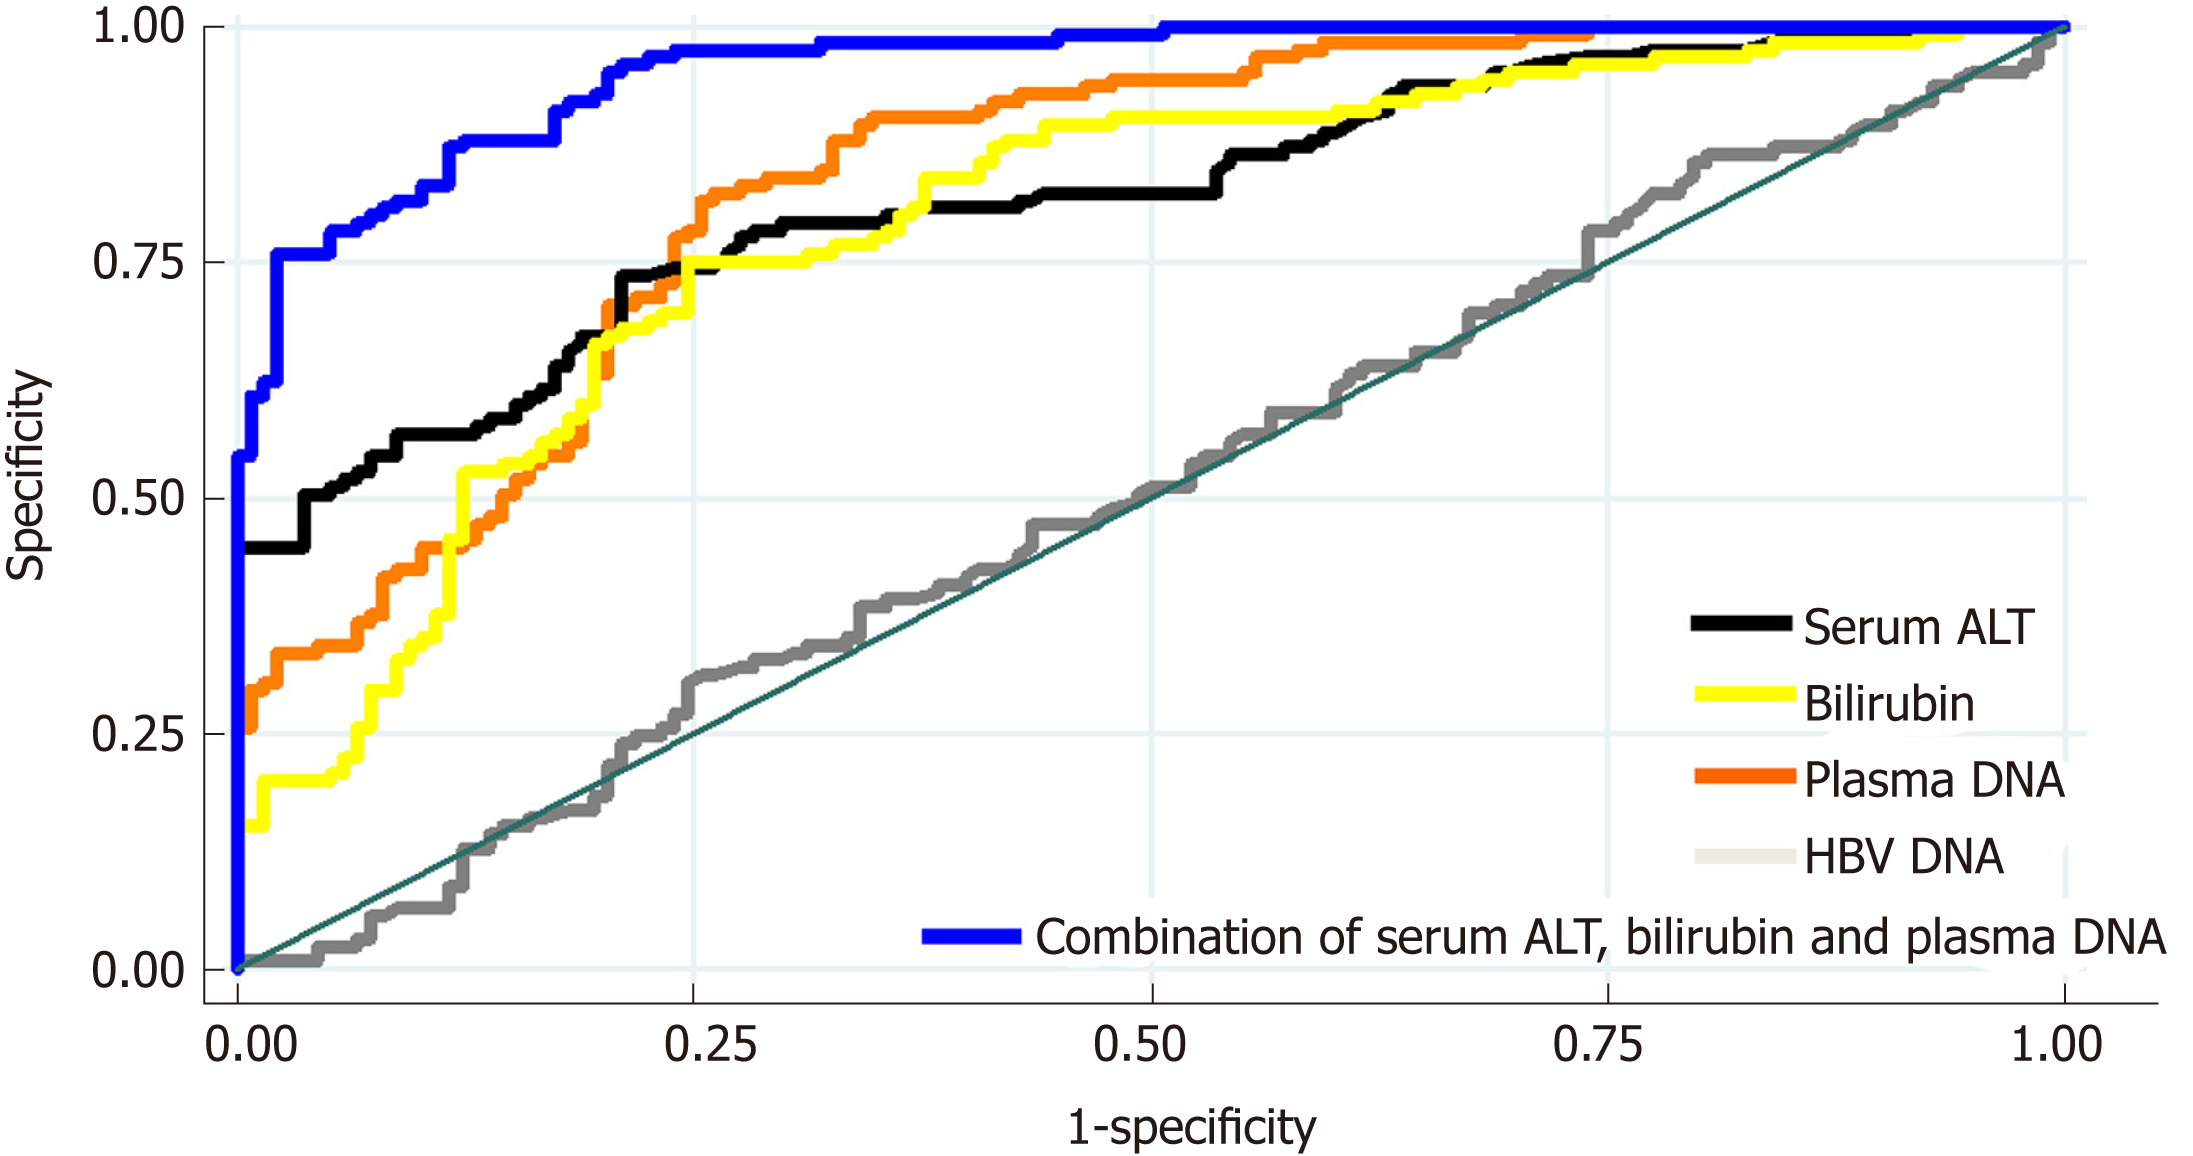
Figure 2 The receiver operator characteristic curves of using four blood biomarkers to assess hepatocellular injury severity in 263 chronic hepatitis B patients.
The areas under the curves (AUCs) of using serum alanine aminotransferase (ALT, black), bilirubin (yellow), plasma DNA (orange), serum aspartate aminotransferase (green), albumin (purple), and hepatitis B virus DNA (gray) to distinguish between patients with mild-moderate and marked-severe inflammation were 0.8059, 0.7910, 0.7921, 0.6530, 0.4877, and 0.4952, respectively. After the combination of serum ALT, bilirubin, and plasma DNA (blue), there was a statistically significant increase of AUC (0.9564). ALT: Alanine aminotransferase; HBV: Hepatitis B virus; AST: Aspartate aminotransferase; AUC: Area under the curve.
- Citation: Xia WY, Gao L, Dai EH, Chen D, Xie EF, Yang L, Zhang SC, Zhang BF, Xu J, Pan SY. Liquid biopsy for non-invasive assessment of liver injury in hepatitis B patients. World J Gastroenterol 2019; 25(29): 3985-3995
- URL: https://www.wjgnet.com/1007-9327/full/v25/i29/3985.htm
- DOI: https://dx.doi.org/10.3748/wjg.v25.i29.3985


