Copyright
©The Author(s) 2019.
World J Gastroenterol. Jul 21, 2019; 25(27): 3619-3633
Published online Jul 21, 2019. doi: 10.3748/wjg.v25.i27.3619
Published online Jul 21, 2019. doi: 10.3748/wjg.v25.i27.3619
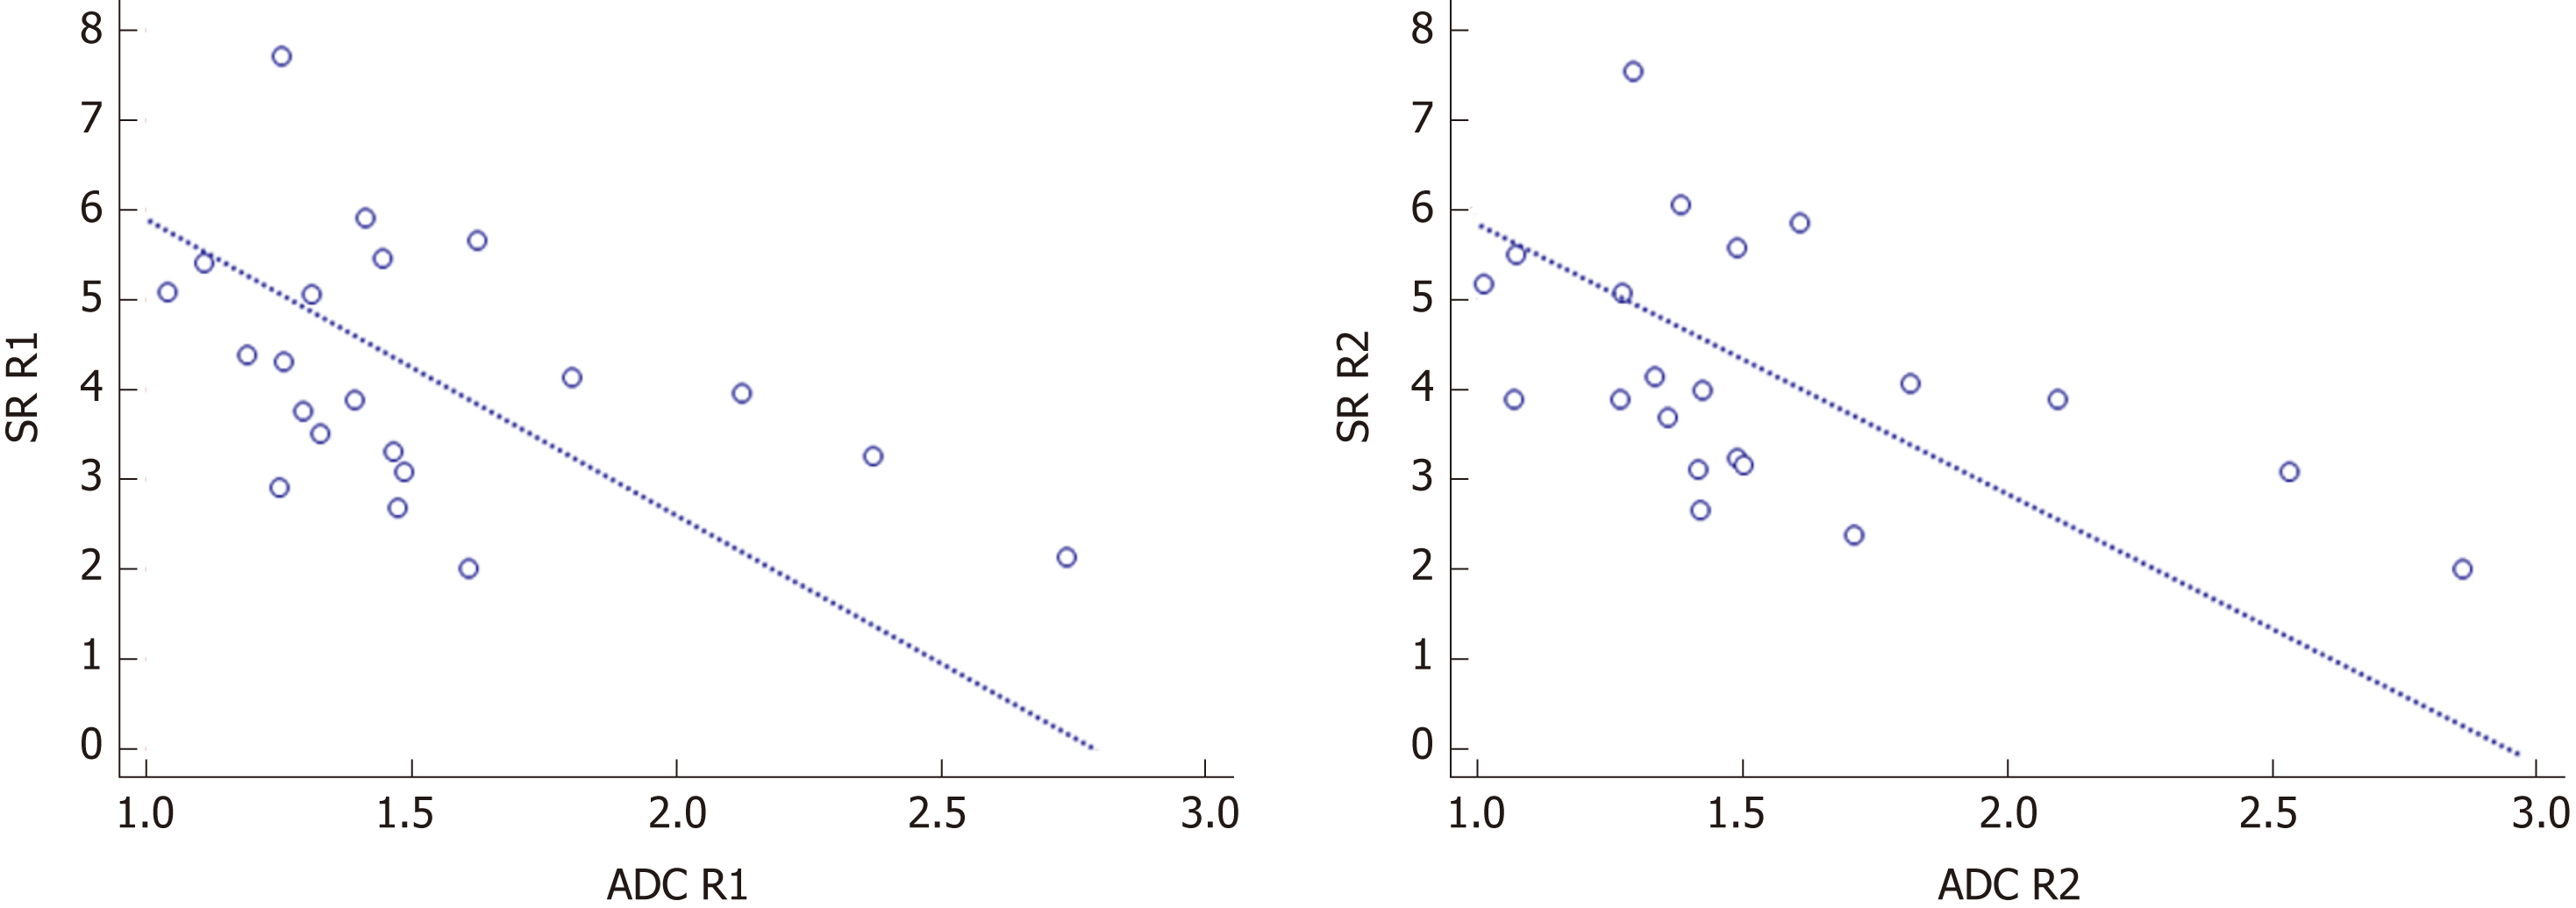
Figure 5 Scatterplots between apparent diffusion coefficient and signal ratio of reader 1 and reader 2.
Reader 1: r = -0.438, P = 0.047; Reader 2: r = -0.485, P = 0.026; R1: reader 1; R2: reader 2. ADC: Apparent diffusion coefficient; SR: Signal ratio; R1: Reader 1; R2: Reader 2.
- Citation: Yu H, Shen YQ, Tan FQ, Zhou ZL, Li Z, Hu DY, Morelli JN. Quantitative diffusion-weighted magnetic resonance enterography in ileal Crohn's disease: A systematic analysis of intra and interobserver reproducibility. World J Gastroenterol 2019; 25(27): 3619-3633
- URL: https://www.wjgnet.com/1007-9327/full/v25/i27/3619.htm
- DOI: https://dx.doi.org/10.3748/wjg.v25.i27.3619


