Copyright
©The Author(s) 2019.
World J Gastroenterol. Jul 21, 2019; 25(27): 3572-3589
Published online Jul 21, 2019. doi: 10.3748/wjg.v25.i27.3572
Published online Jul 21, 2019. doi: 10.3748/wjg.v25.i27.3572
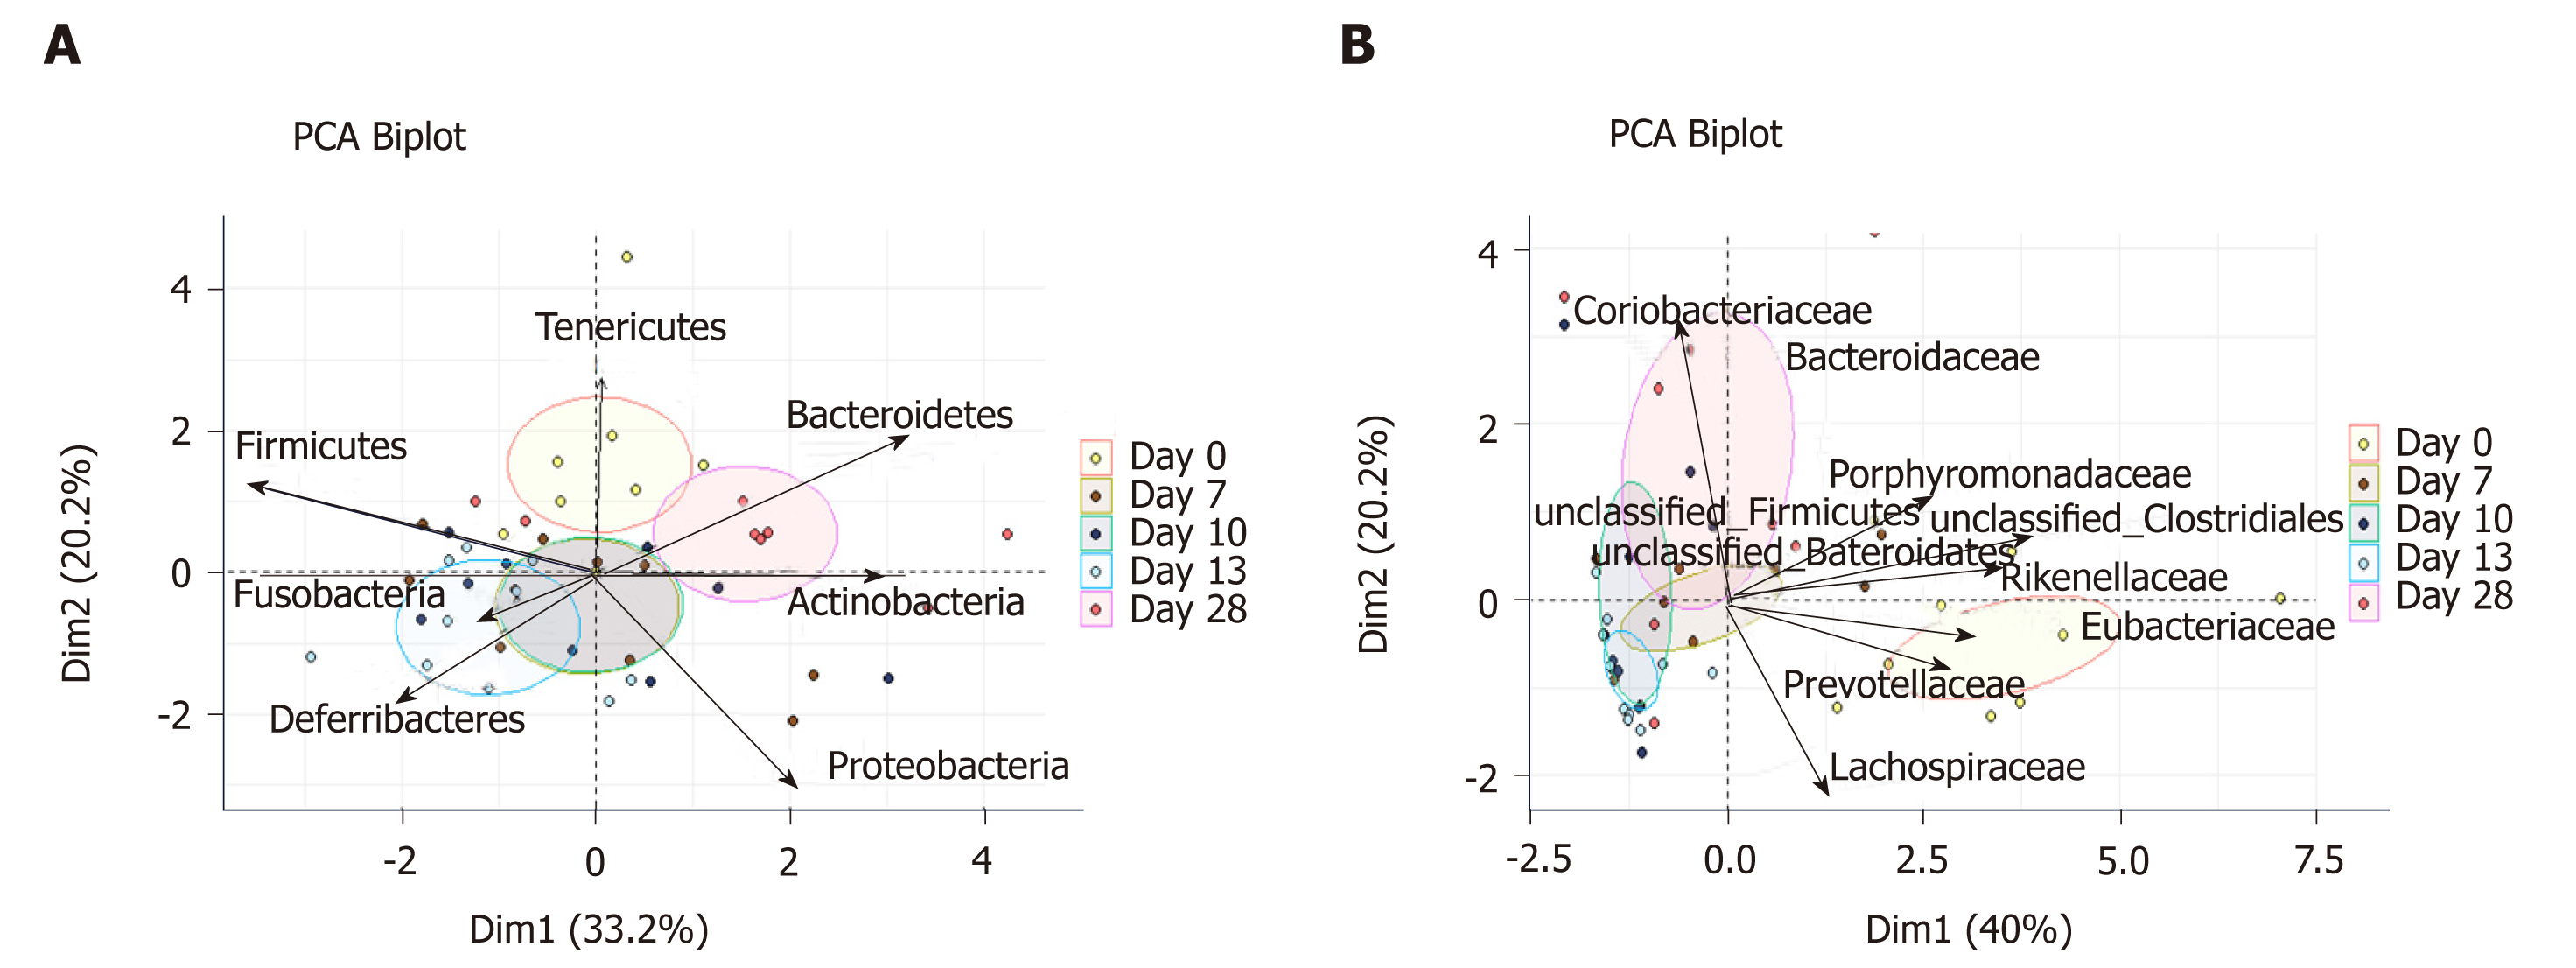
Figure 4 Principal component analysis of relative abundances of mucosa-adherent microbiota.
A: Phylum level; B: Family level. Partial sample clustering by time was observed. PCA: Principal component analysis.
- Citation: Vidal-Lletjós S, Andriamihaja M, Blais A, Grauso M, Lepage P, Davila AM, Gaudichon C, Leclerc M, Blachier F, Lan A. Mucosal healing progression after acute colitis in mice. World J Gastroenterol 2019; 25(27): 3572-3589
- URL: https://www.wjgnet.com/1007-9327/full/v25/i27/3572.htm
- DOI: https://dx.doi.org/10.3748/wjg.v25.i27.3572


