Copyright
©The Author(s) 2019.
World J Gastroenterol. Jul 21, 2019; 25(27): 3572-3589
Published online Jul 21, 2019. doi: 10.3748/wjg.v25.i27.3572
Published online Jul 21, 2019. doi: 10.3748/wjg.v25.i27.3572
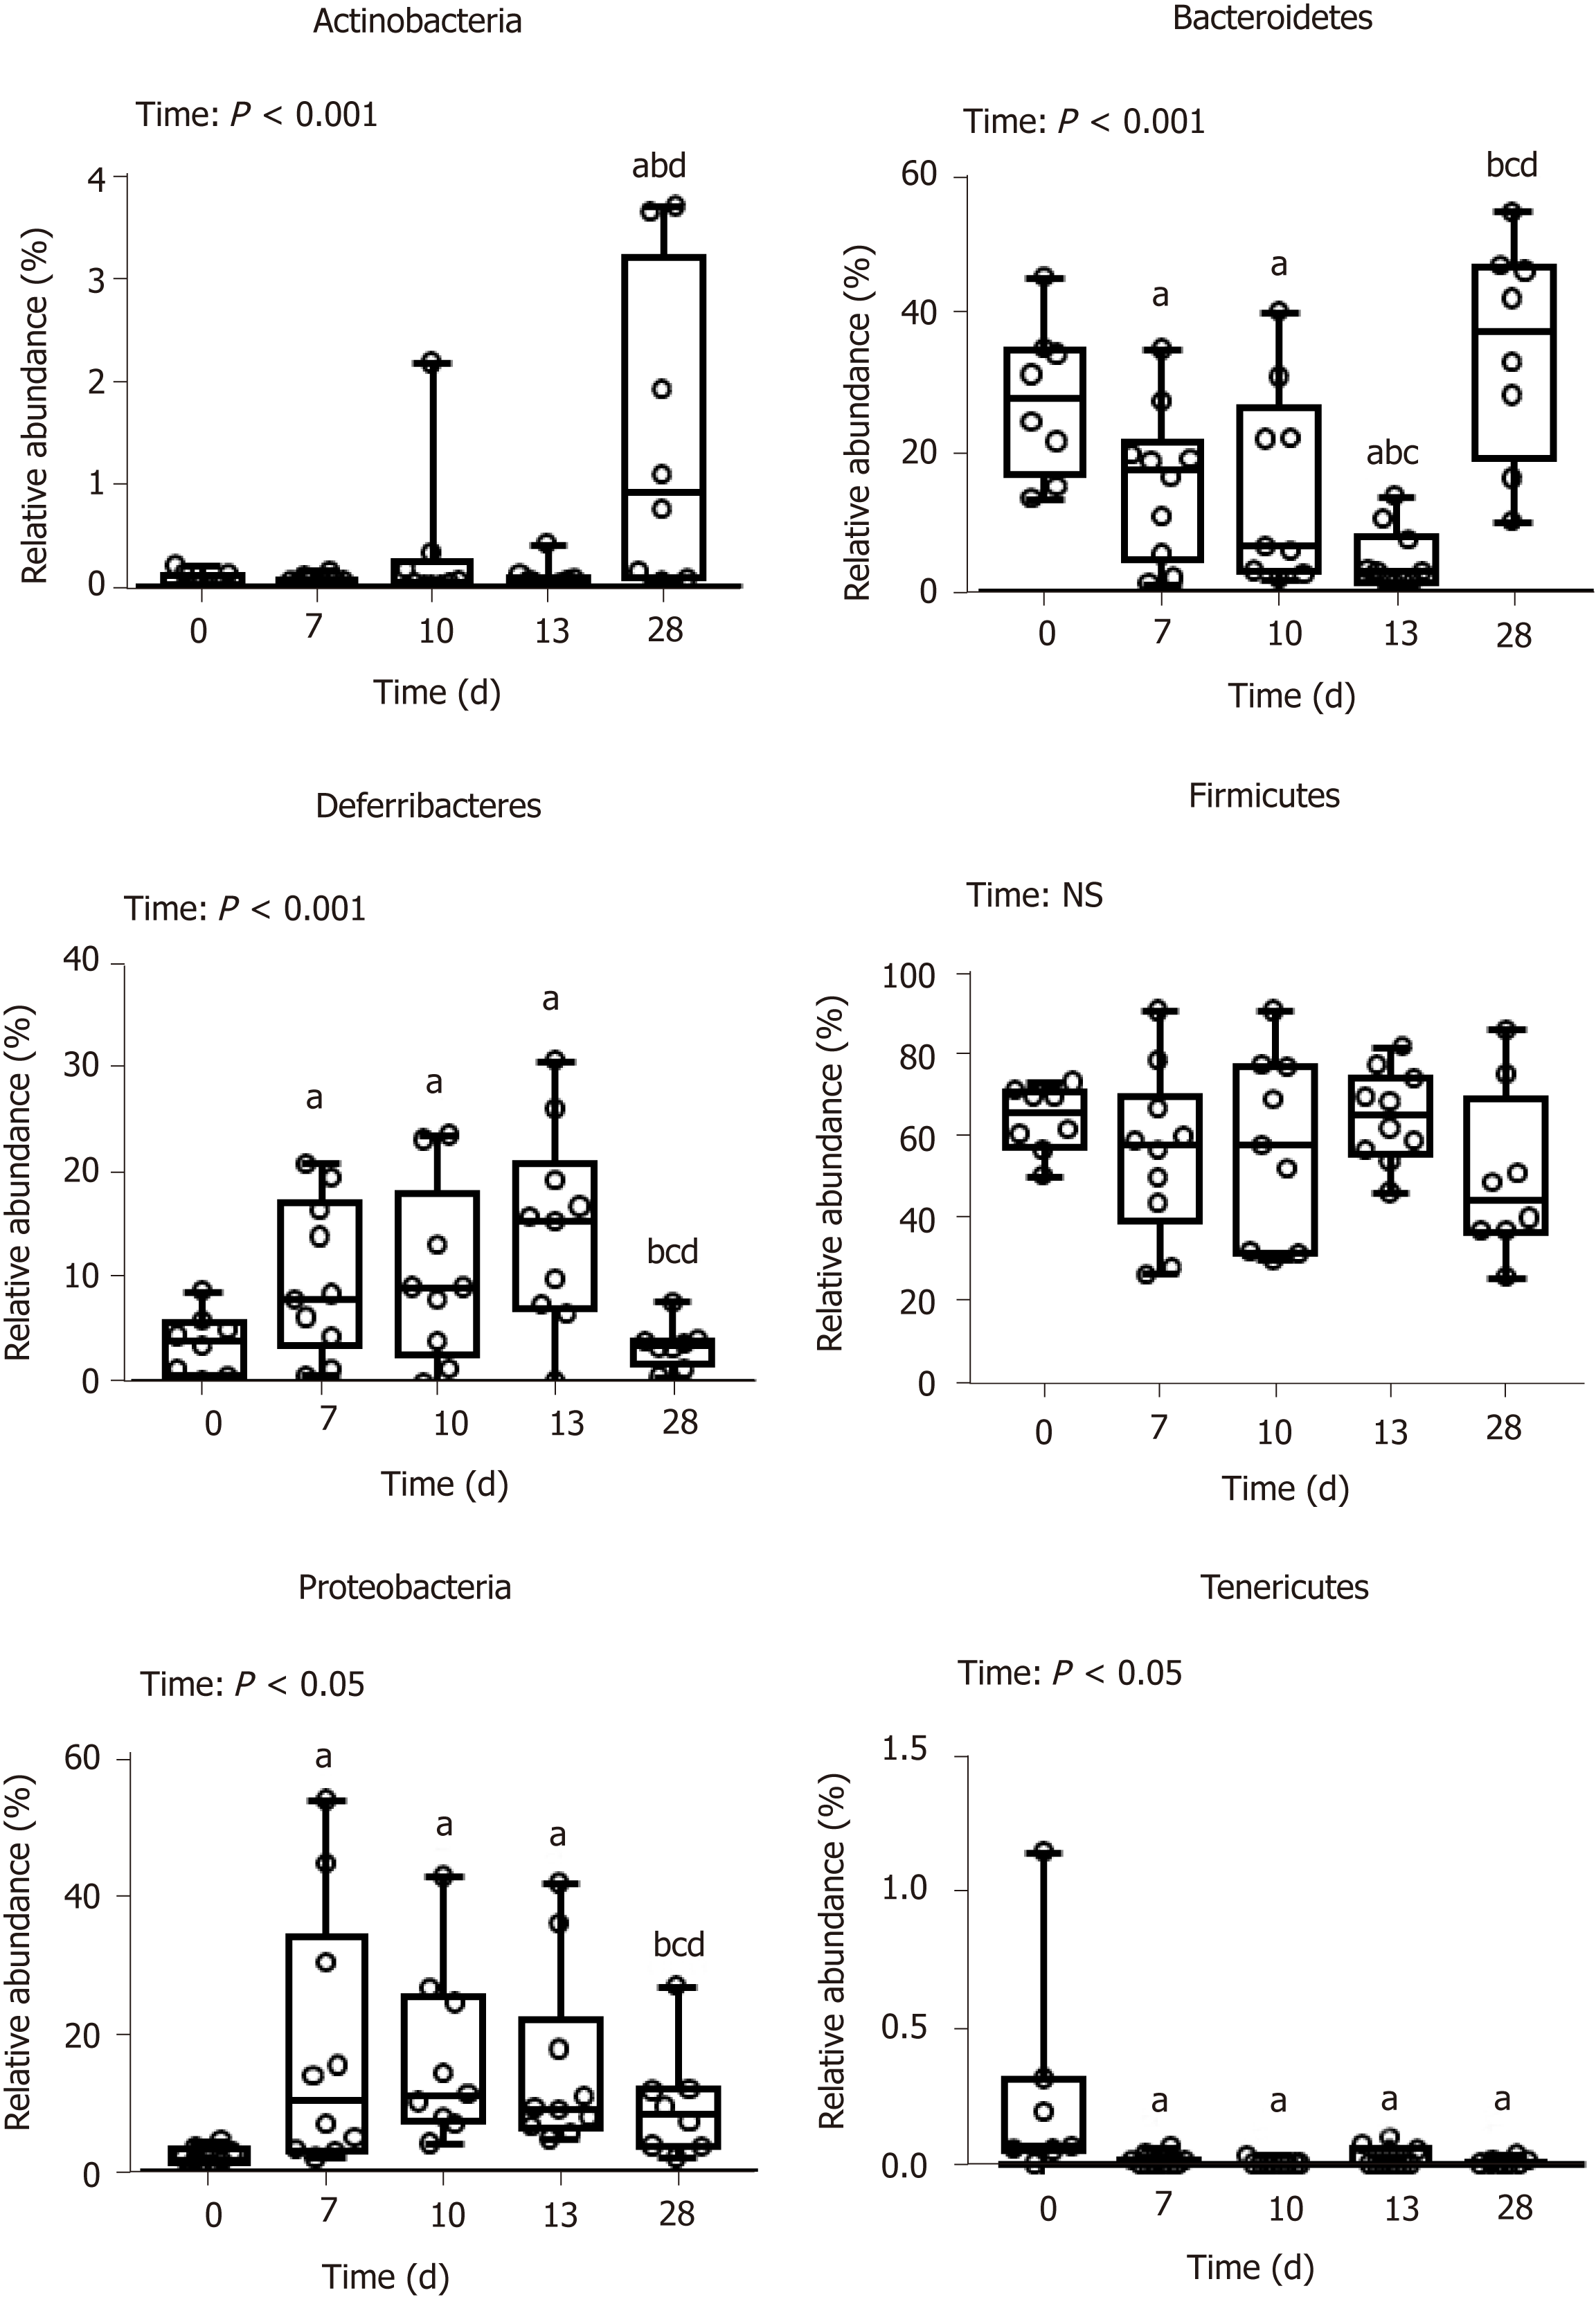
Figure 3 Phylum-relative abundance of mucosa-adherent microbiota.
Values are means ± SE (n = 8-12). Means with different superscripts are significantly different. aP < 0.05 vs day 0; bP < 0.05 vs day 7, cP < 0.05 vs day 10; dP < 0.05 vs day 13. SE: Standard error; NS: Non-significant difference.
- Citation: Vidal-Lletjós S, Andriamihaja M, Blais A, Grauso M, Lepage P, Davila AM, Gaudichon C, Leclerc M, Blachier F, Lan A. Mucosal healing progression after acute colitis in mice. World J Gastroenterol 2019; 25(27): 3572-3589
- URL: https://www.wjgnet.com/1007-9327/full/v25/i27/3572.htm
- DOI: https://dx.doi.org/10.3748/wjg.v25.i27.3572


