Copyright
©The Author(s) 2019.
World J Gastroenterol. Jul 14, 2019; 25(26): 3392-3407
Published online Jul 14, 2019. doi: 10.3748/wjg.v25.i26.3392
Published online Jul 14, 2019. doi: 10.3748/wjg.v25.i26.3392
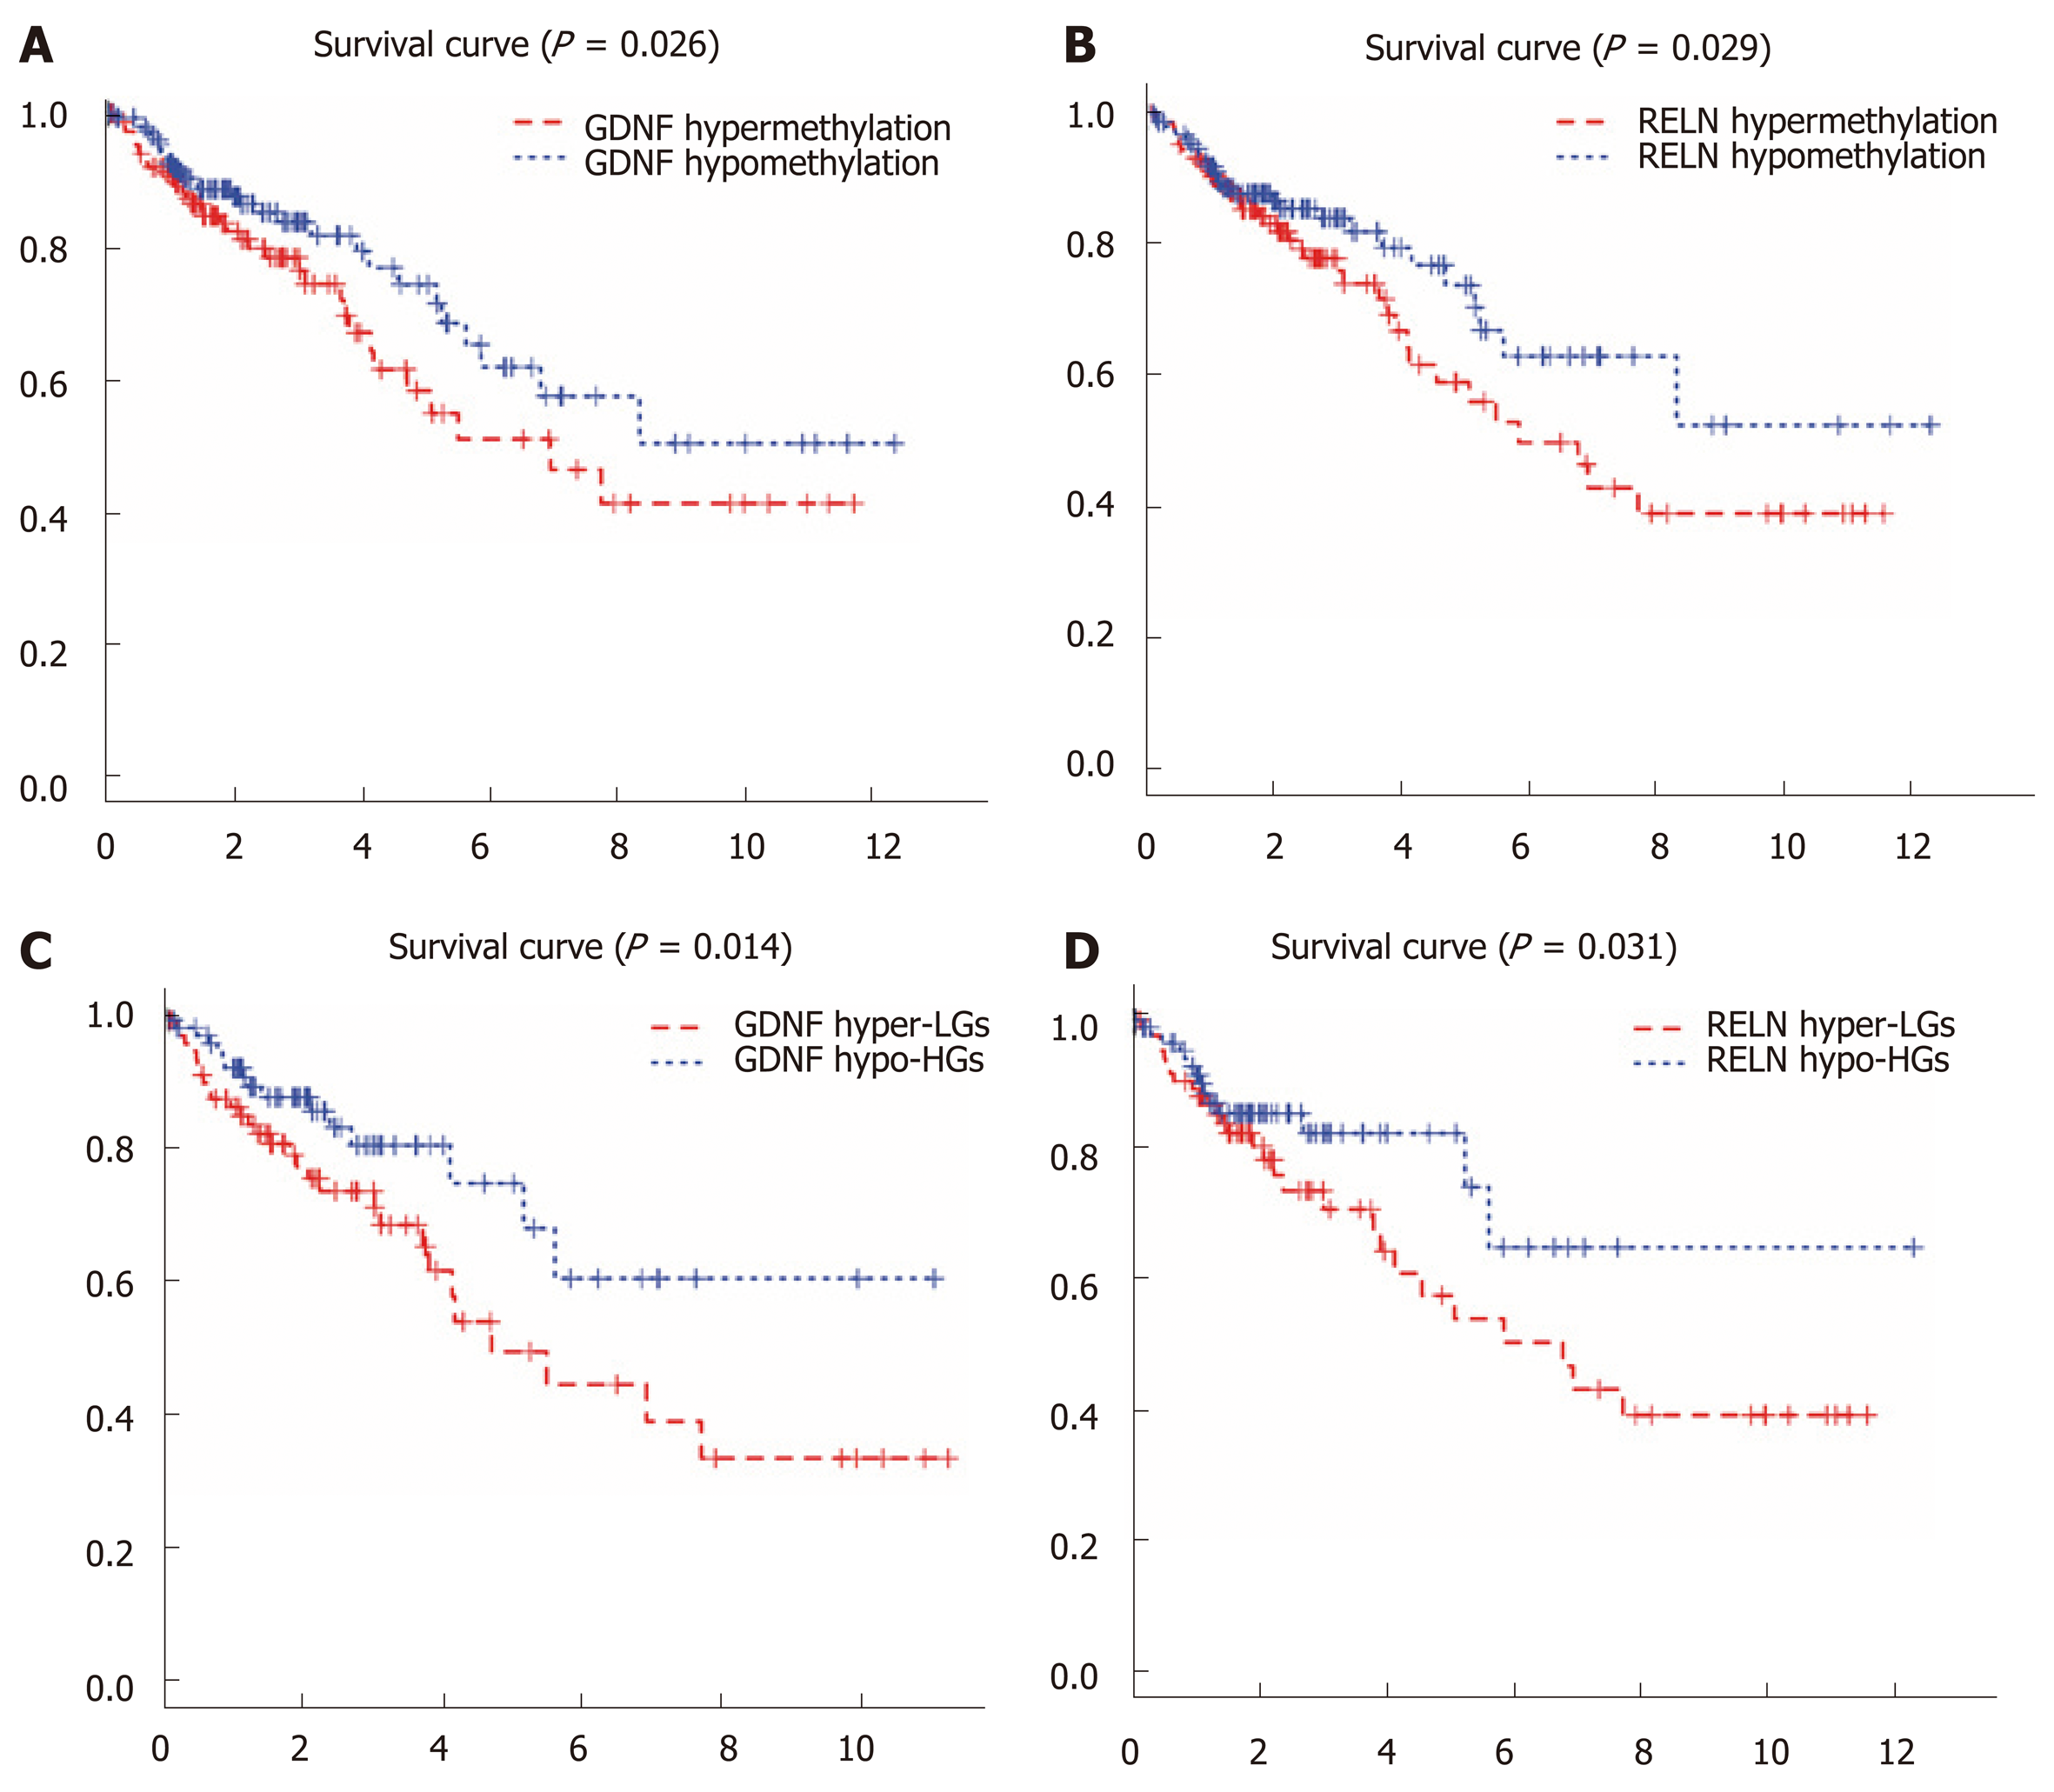
Figure 4 Kaplan-Meier curves for the methylation and methylation-expression of glial cell-derived neurotrophic factor and reelin.
A and B: Glial cell-derived neurotrophic factor (GDNF) and reelin (RELN) were ranked by the median of methylation and then scored for each colon cancer patient in accordance with high- or low-level methylation value; C and D: GDNF and RELN were ranked by the median of methylation and expression and then scored for each colon cancer patient in accordance with high- or low-level methylation value and high or low-level expression value. The horizontal axis represents the overall survival time and the vertical axis represents survival function. Hyper-LGs: Hypermethylation and low expression methylation-regulated differentially expressed genes; Hypo-HGs: Hypomethylation and high expression methylation-regulated differentially expressed genes; GDNF: Glial cell-derived neurotrophic factor; RELN: Reelin.
- Citation: Liang Y, Zhang C, Dai DQ. Identification of differentially expressed genes regulated by methylation in colon cancer based on bioinformatics analysis. World J Gastroenterol 2019; 25(26): 3392-3407
- URL: https://www.wjgnet.com/1007-9327/full/v25/i26/3392.htm
- DOI: https://dx.doi.org/10.3748/wjg.v25.i26.3392


