Copyright
©The Author(s) 2019.
World J Gastroenterol. Jul 7, 2019; 25(25): 3218-3230
Published online Jul 7, 2019. doi: 10.3748/wjg.v25.i25.3218
Published online Jul 7, 2019. doi: 10.3748/wjg.v25.i25.3218
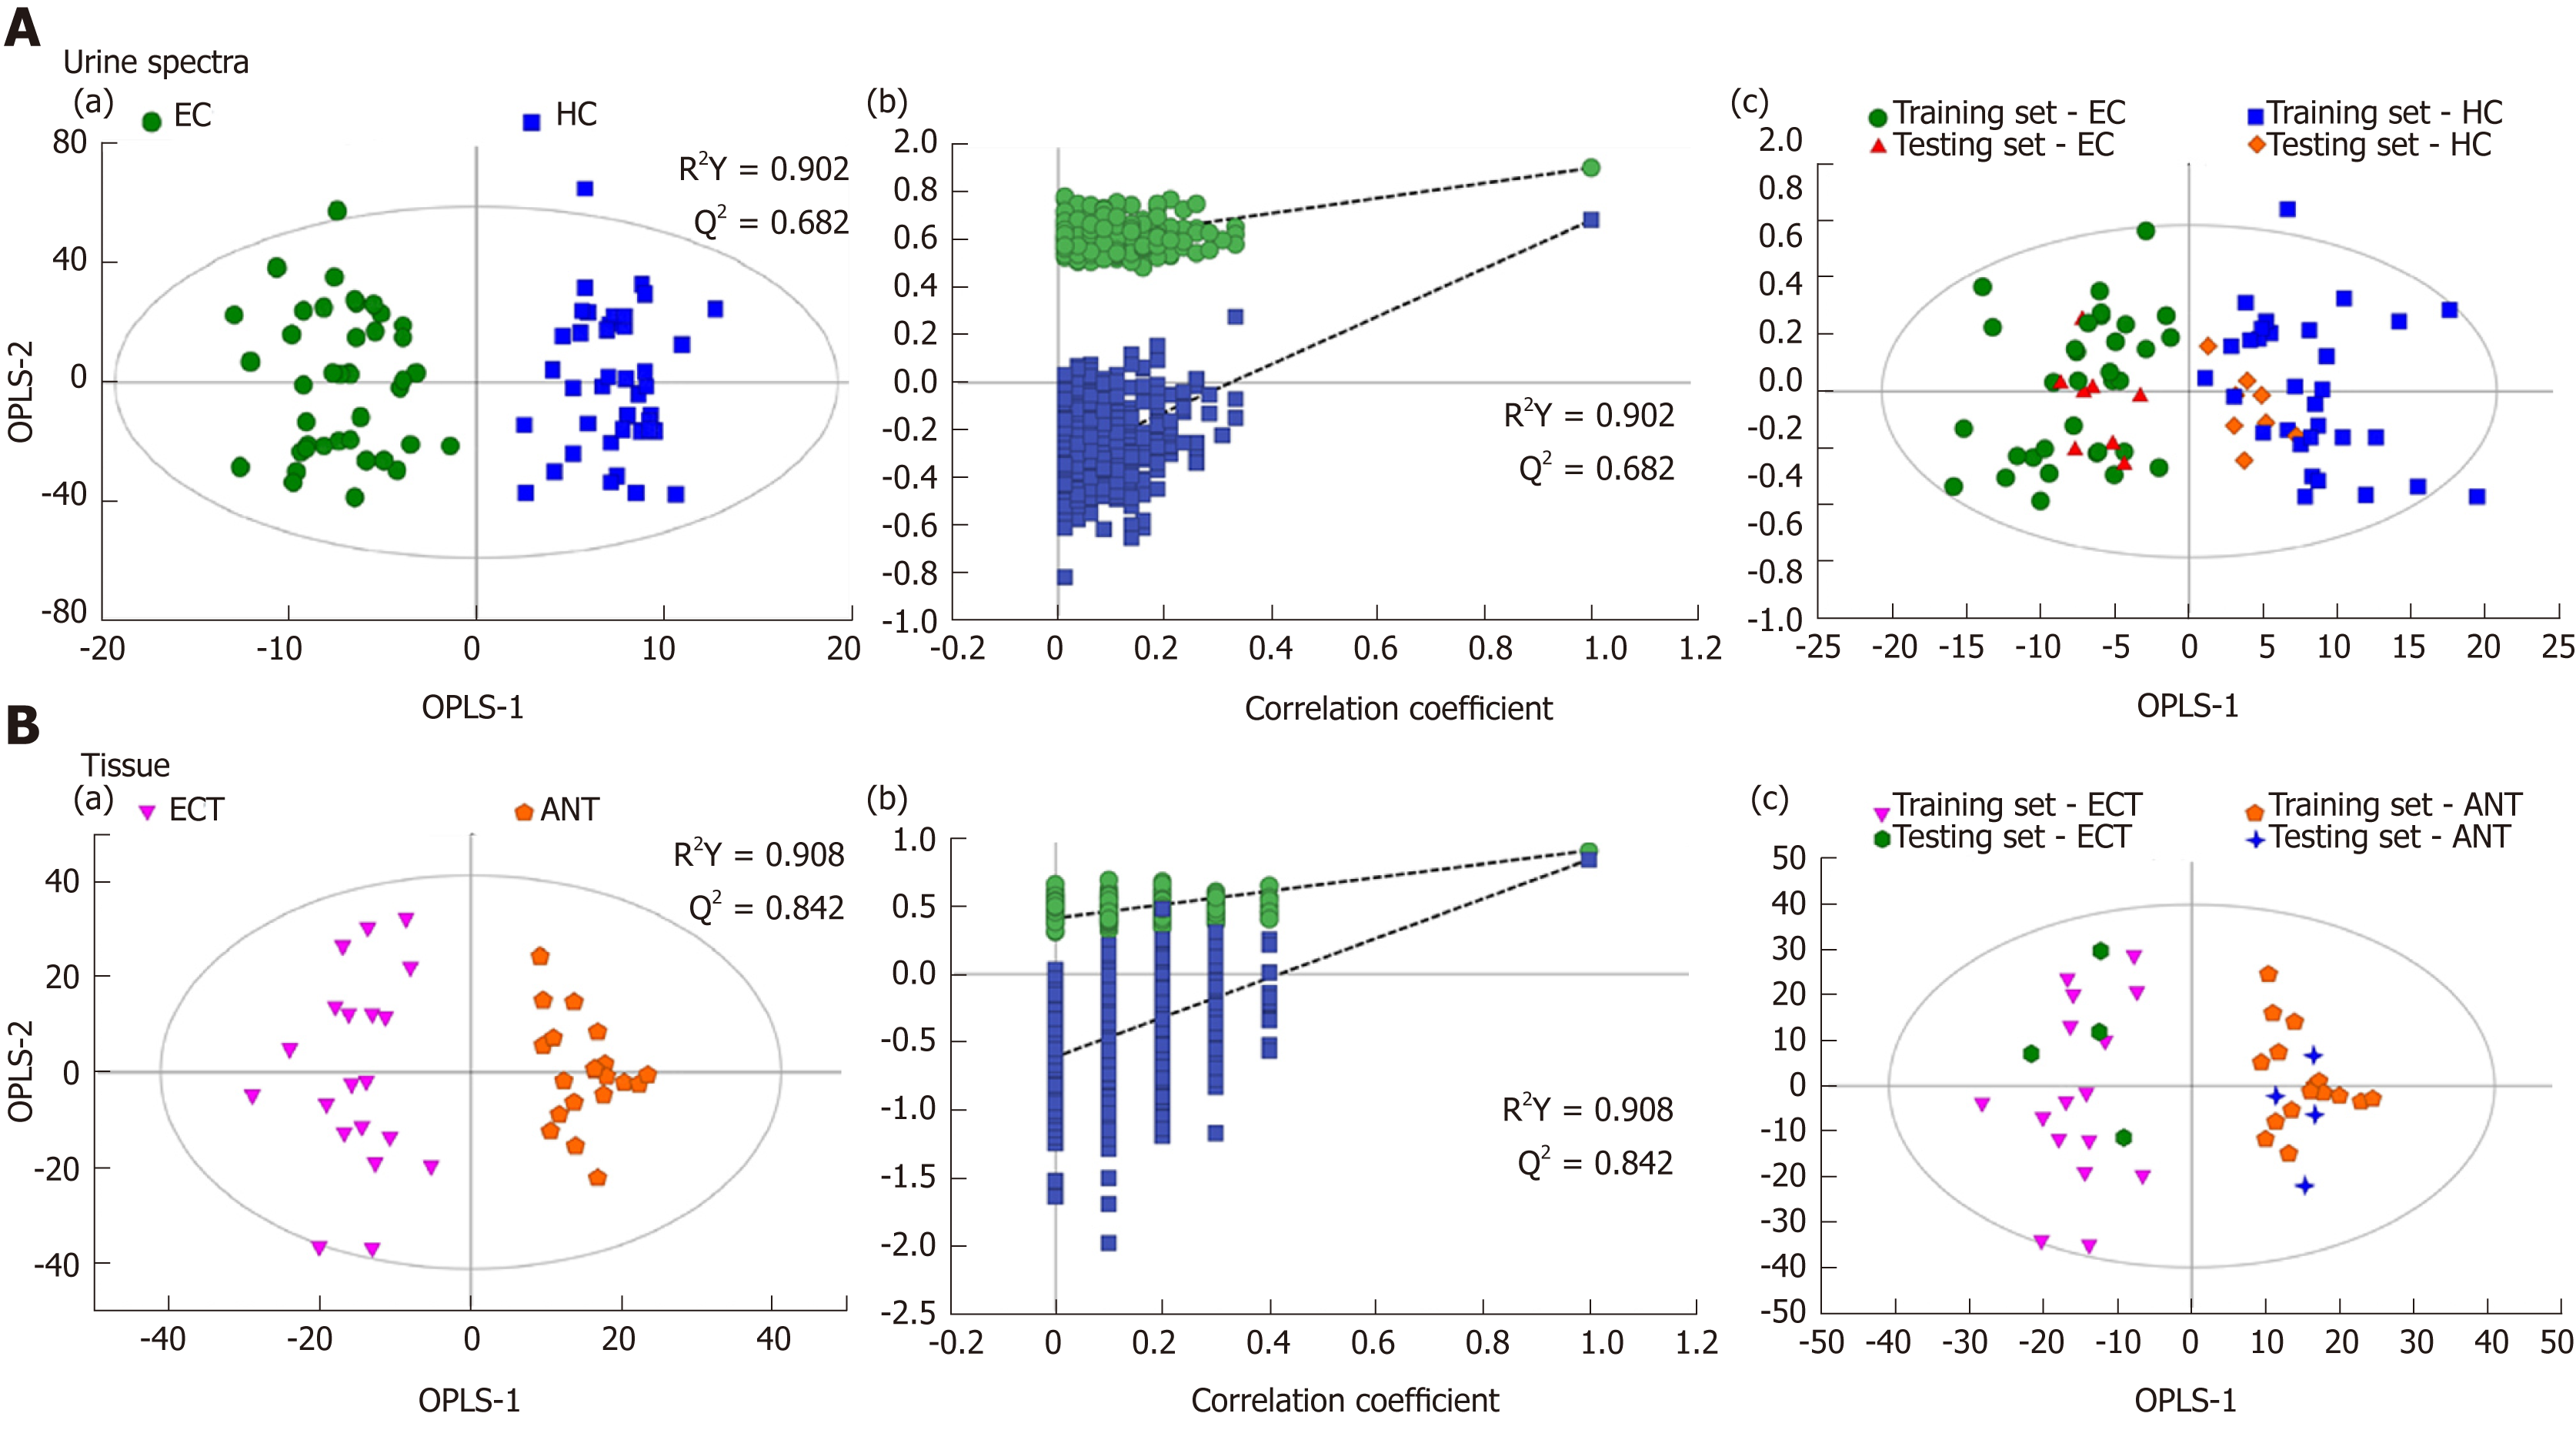
Figure 2 Pattern recognitions.
A: Pattern recognition of urine metabolomic profiles analyzed by proton nuclear magnetic resonance (1H-NMR) spectroscopy. (a) orthogonal partial least squares discriminant analysis (OPLS-DA) scatter plot of urine samples based on esophageal cancer (EC) patients (green dots) and healthy controls (HCs) (blue squares); (b) Statistical validation of the corresponding OPLS-DA model by permutation analysis (400 times); (c) Score plots of OPLS-DA prediction model. 80% of samples were applied to construct the model, which was used to predict the remaining 20% of samples [testing set, 8 HCs (gold diamonds); 8 EC patients (red triangles)]; B: Pattern recognition of tissue metabolomic profiles analyzed by 1H-NMR spectroscopy. (a) OPLS-DA scatter plot of EC tissue samples obtained (purple inverted triangles) and adjacent noncancerous tissue (orange pentagons); (b) Statistical validation of the corresponding OPLS-DA model by permutation analysis (400 times); (c) Score plots of OPLS-DA prediction model, with 80% of the samples applied to construct the model, which was used to predict the remaining 20% of samples [testing set, 4 EC tissues (green hexagons); 4 adjacent non-cancerous tissues (blue crosses)].
- Citation: Liang JH, Lin Y, Ouyang T, Tang W, Huang Y, Ye W, Zhao JY, Wang ZN, Ma CC. Nuclear magnetic resonance-based metabolomics and metabolic pathway networks from patient-matched esophageal carcinoma, adjacent noncancerous tissues and urine. World J Gastroenterol 2019; 25(25): 3218-3230
- URL: https://www.wjgnet.com/1007-9327/full/v25/i25/3218.htm
- DOI: https://dx.doi.org/10.3748/wjg.v25.i25.3218


