Copyright
©The Author(s) 2019.
World J Gastroenterol. Jun 21, 2019; 25(23): 2947-2960
Published online Jun 21, 2019. doi: 10.3748/wjg.v25.i23.2947
Published online Jun 21, 2019. doi: 10.3748/wjg.v25.i23.2947
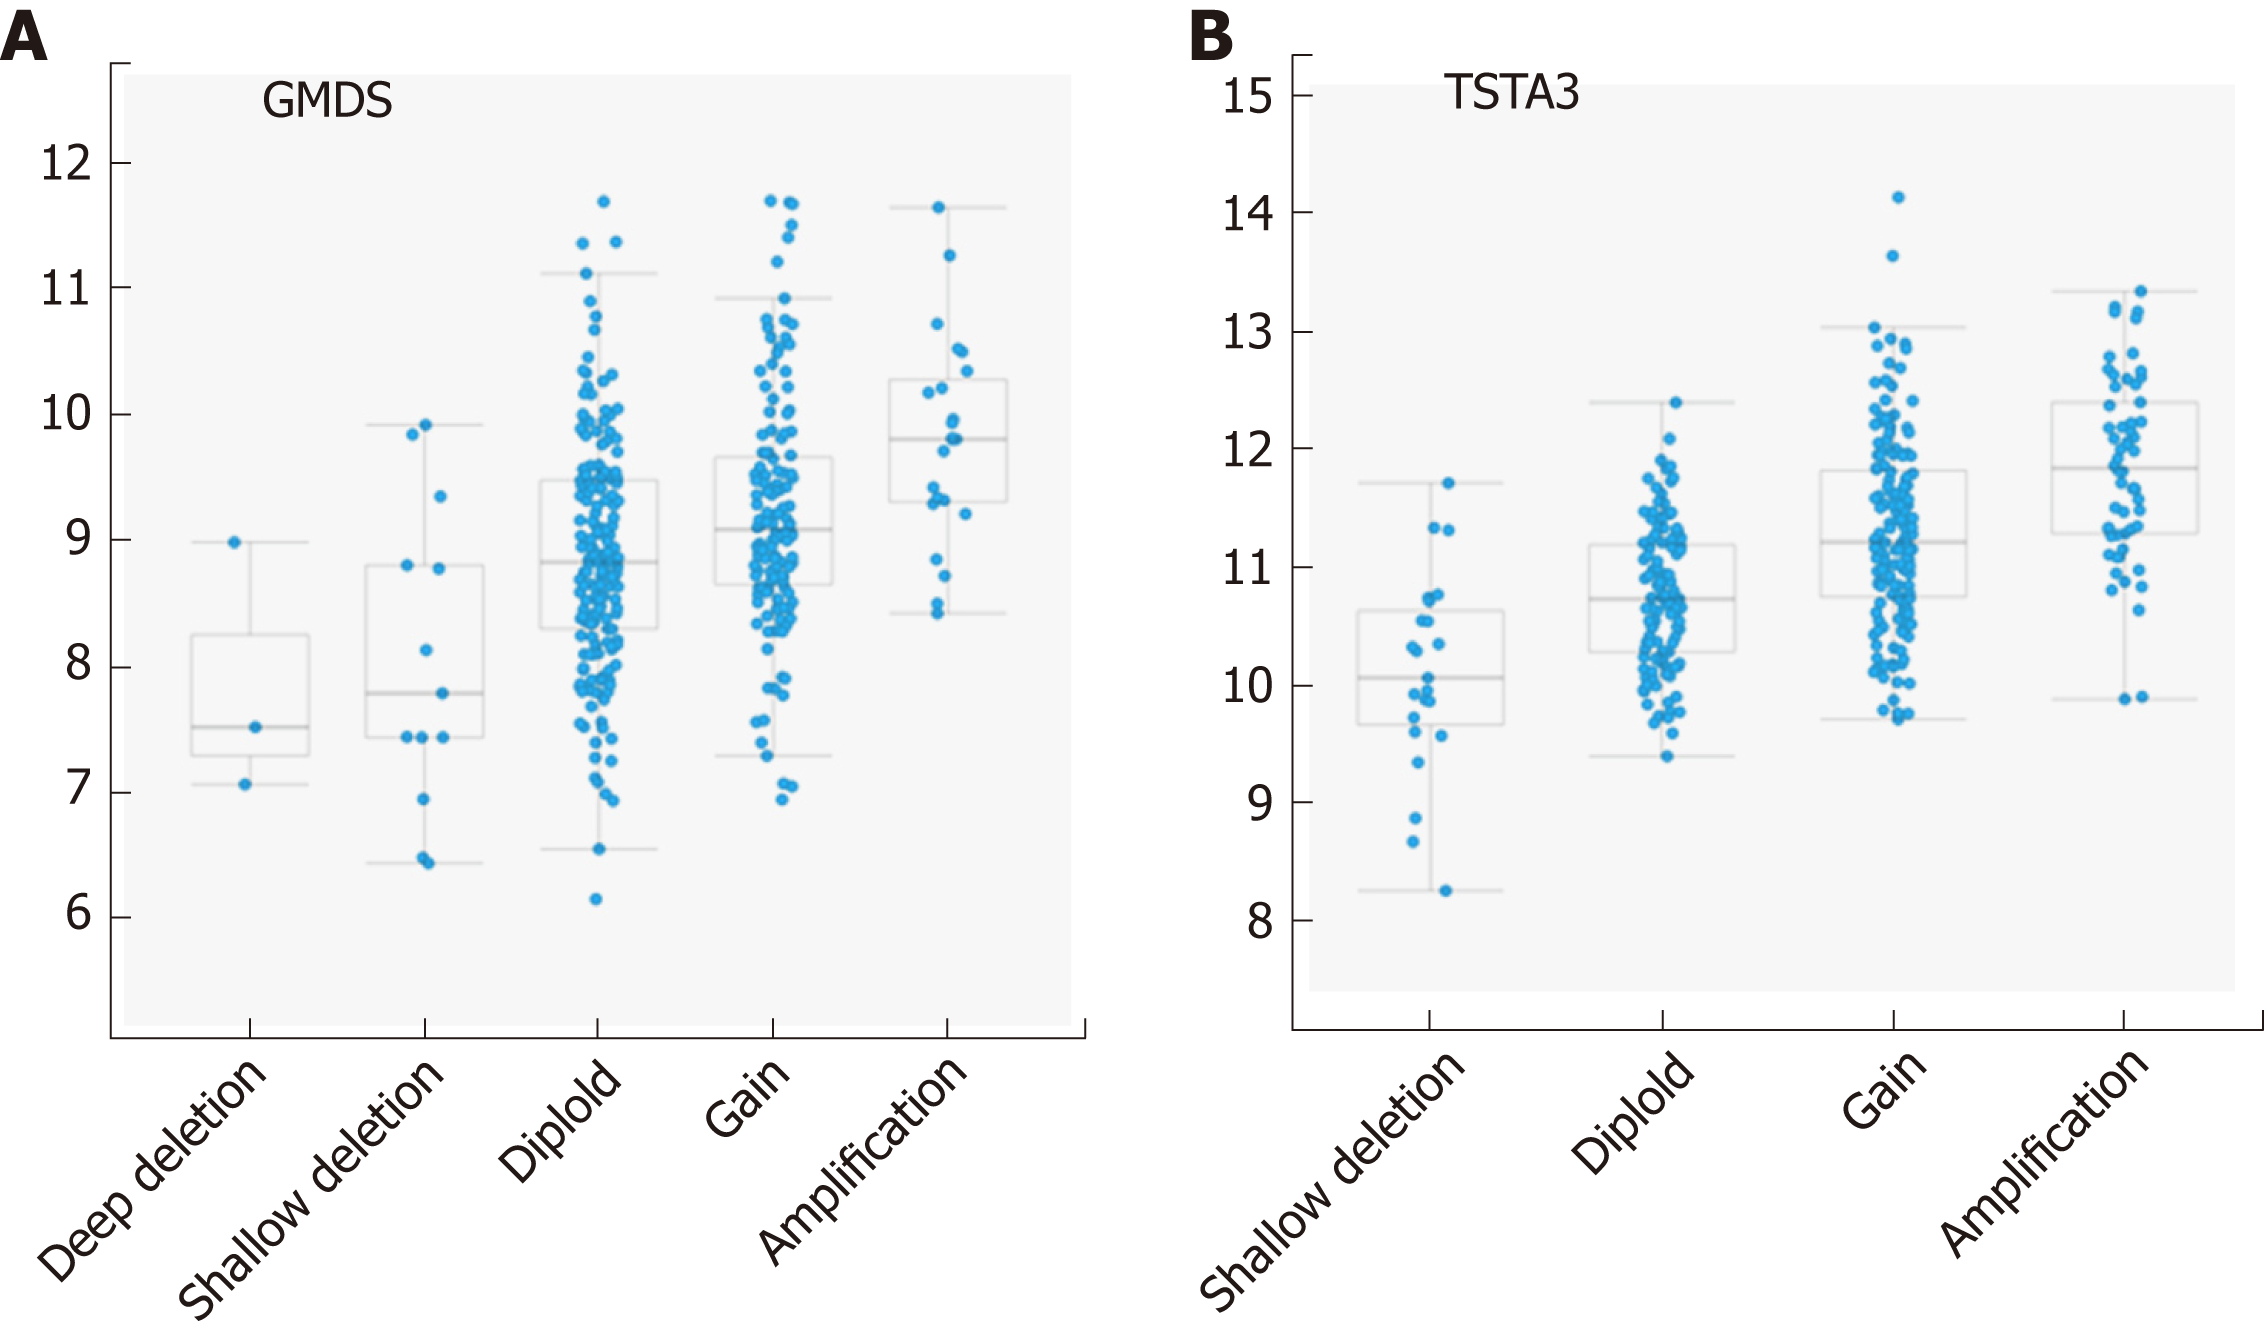
Figure 3 Correlation plots illustrating the relationship between mRNA expression levels for GMDS and TSTA3 on the Y axes (log base 2) and putative copy number changes (GISTIC2 calls, see materials and methods[26]) on the X axes.
Possible GISTIC2 scores are -2 = Deep (homozygous) deletion; -1 = Shallow (hemizygous) deletion; 0 = neutral/diploid; 1 = gain (low copy); 2 = high level amplification.
- Citation: Norton PA, Mehta AS. Expression of genes that control core fucosylation in hepatocellular carcinoma: Systematic review. World J Gastroenterol 2019; 25(23): 2947-2960
- URL: https://www.wjgnet.com/1007-9327/full/v25/i23/2947.htm
- DOI: https://dx.doi.org/10.3748/wjg.v25.i23.2947


