Copyright
©The Author(s) 2019.
World J Gastroenterol. Jun 14, 2019; 25(22): 2819-2832
Published online Jun 14, 2019. doi: 10.3748/wjg.v25.i22.2819
Published online Jun 14, 2019. doi: 10.3748/wjg.v25.i22.2819
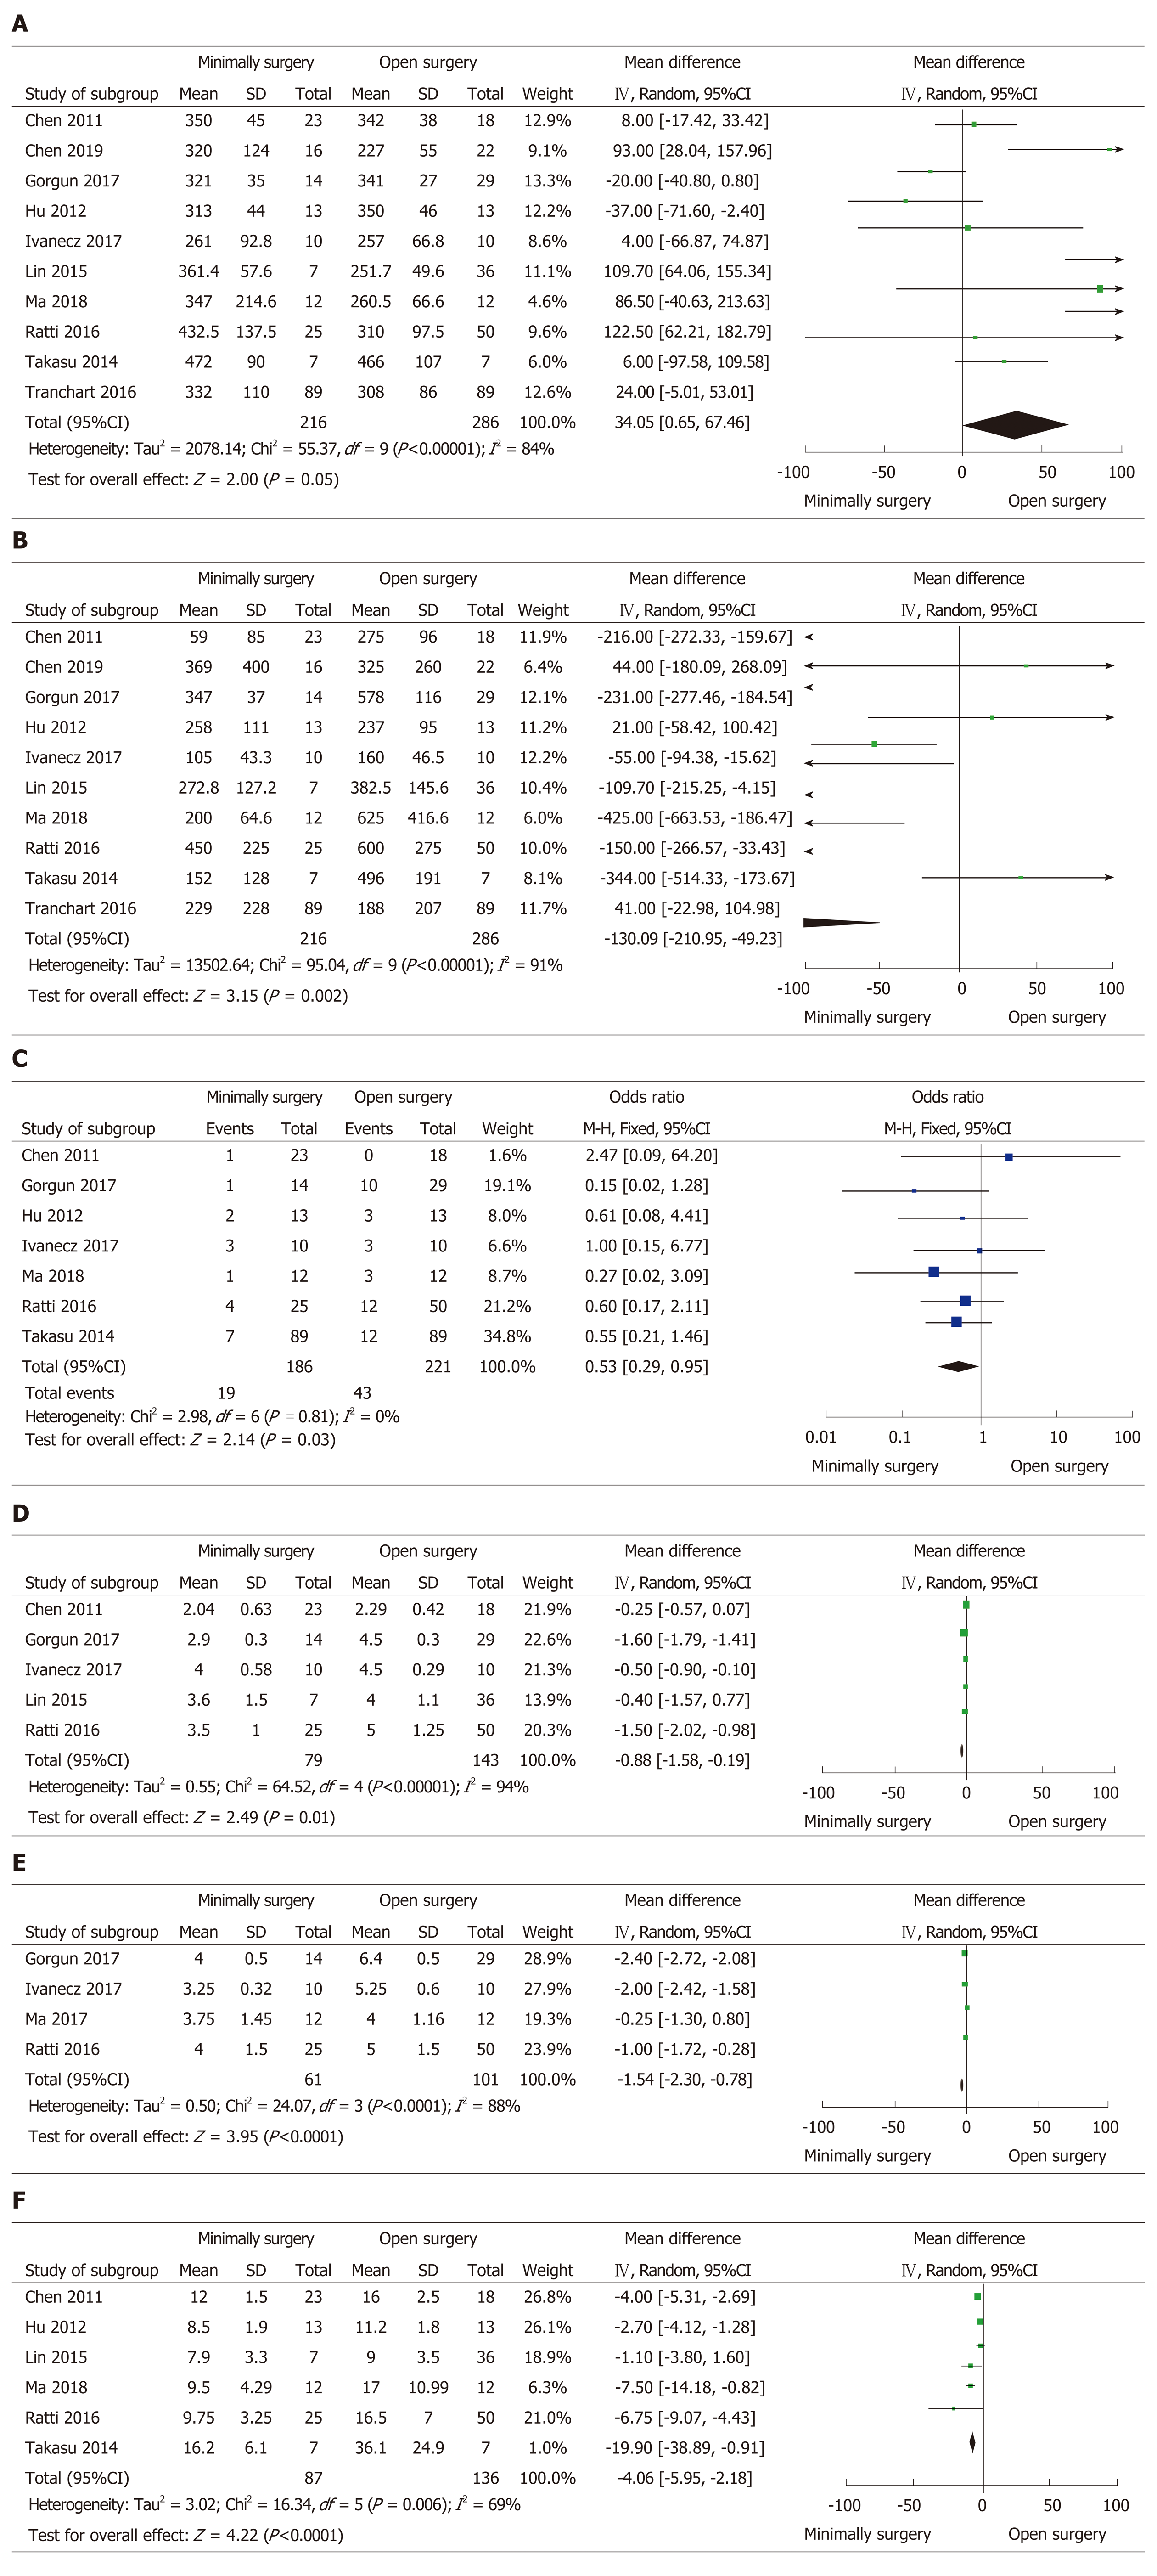
Figure 2 Forest plots of the meta-analysis for intraoperative outcomes.
A: The operative time was compared between the minimally invasive surgery (MIS) and open surgery (OS) groups; B: Intraoperative estimated blood loss was compared between the MIS and OS groups; C: Number of intraoperative blood transfusions was compared between the MIS and OS groups; D: Time to bowel functional recovery was compared between the MIS and OS groups; E: Time to start diet was compared between the MIS and OS groups; F: Length of postoperative hospital stay was compared between the MIS and OS groups. MIS: Minimally invasive surgery; OS: Open surgery; CI: Confidence interval; SD: Standard deviation.
- Citation: Ye SP, Qiu H, Liao SJ, Ai JH, Shi J. Mini-invasive vs open resection of colorectal cancer and liver metastases: A meta-analysis. World J Gastroenterol 2019; 25(22): 2819-2832
- URL: https://www.wjgnet.com/1007-9327/full/v25/i22/2819.htm
- DOI: https://dx.doi.org/10.3748/wjg.v25.i22.2819


