Copyright
©The Author(s) 2019.
World J Gastroenterol. Jun 14, 2019; 25(22): 2776-2787
Published online Jun 14, 2019. doi: 10.3748/wjg.v25.i22.2776
Published online Jun 14, 2019. doi: 10.3748/wjg.v25.i22.2776
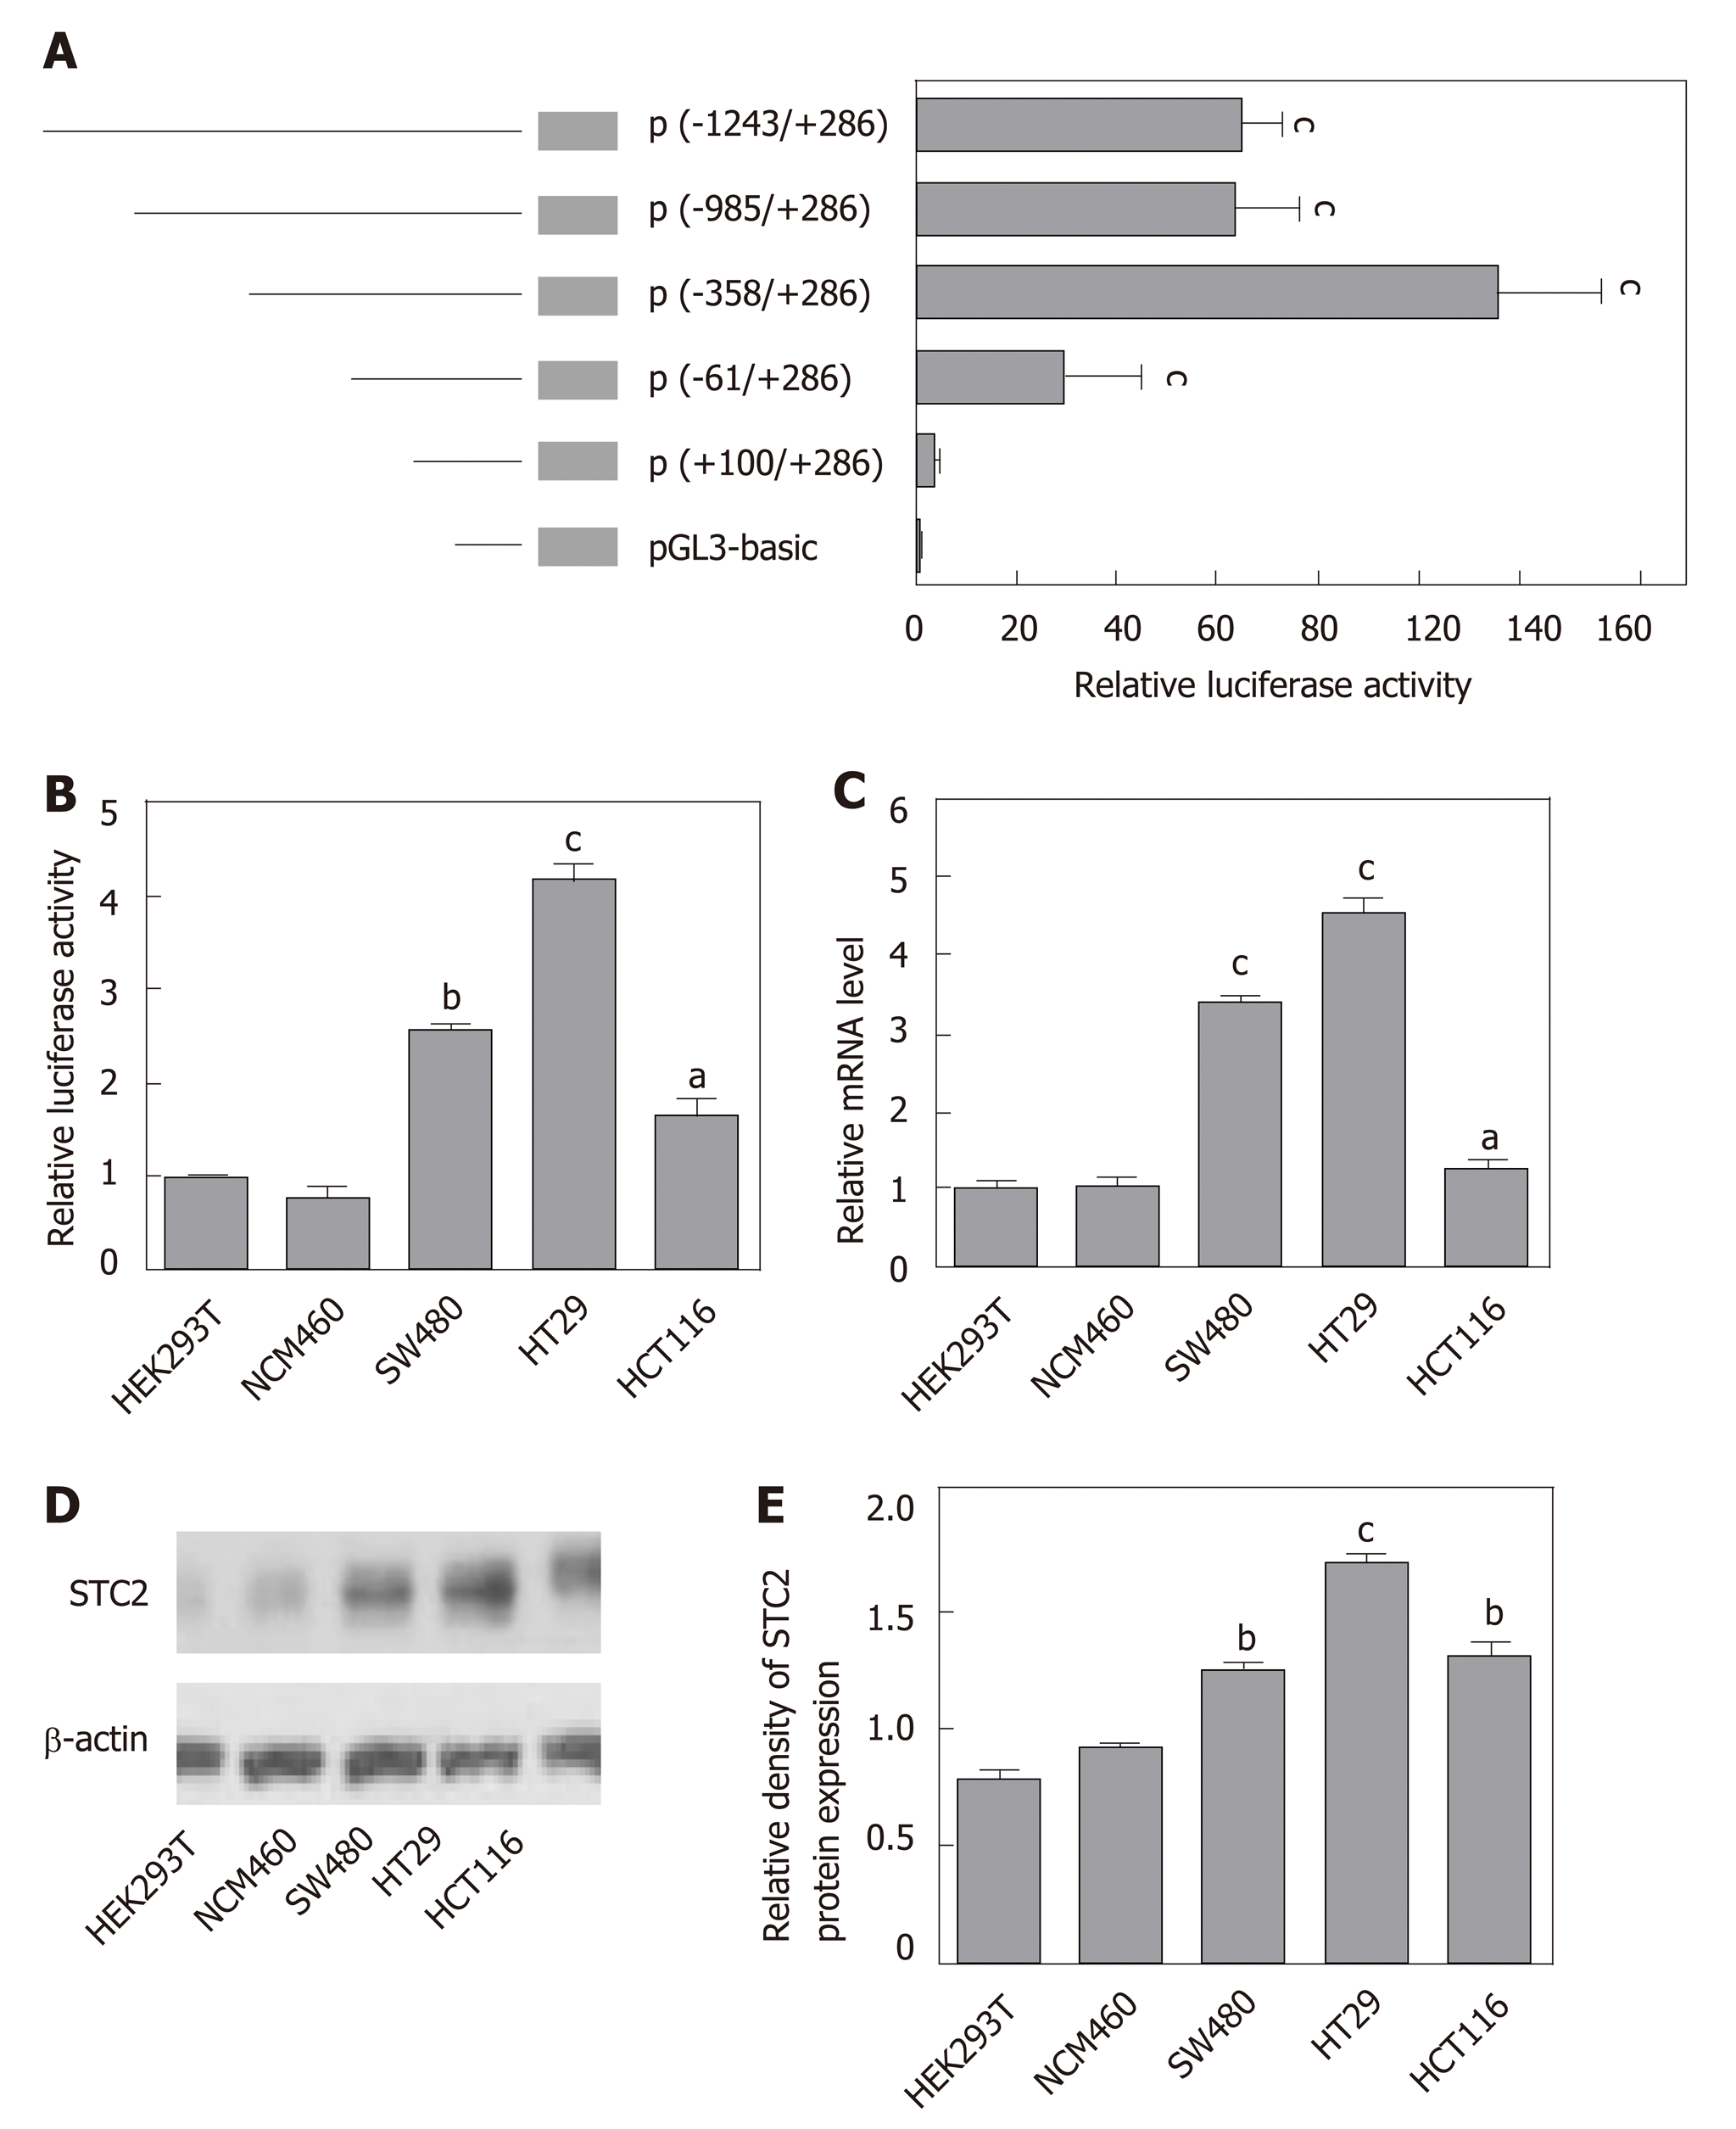
Figure 3 The core region of the STC2 promoter was -358/+286 nt and correlated with the protein levels.
A: The relative promoter activity of different regions of the STC2 promoter was evaluated by luciferase reporter assay in HT29 cells, cP < 0.001 vs pGL3-Basic; B: The relative promoter activity of core region -358/+286 nt and (C: mRNA expression levels were examined in different cell lines, aP < 0.05, bP < 0.01, cP < 0.001 vs HEK293T; D: Western blotting was performed to examine the protein expression of STC2 in different cell lines; E: The relative protein density of panel D was conducted by Quantity One software. bP < 0.01, cP < 0.001 vs HEK293T. STC2: Stanniocalcin 2.
- Citation: Li JB, Liu ZX, Zhang R, Ma SP, Lin T, Li YX, Yang SH, Zhang WC, Wang YP. Sp1 contributes to overexpression of stanniocalcin 2 through regulation of promoter activity in colon adenocarcinoma. World J Gastroenterol 2019; 25(22): 2776-2787
- URL: https://www.wjgnet.com/1007-9327/full/v25/i22/2776.htm
- DOI: https://dx.doi.org/10.3748/wjg.v25.i22.2776


