Copyright
©The Author(s) 2019.
World J Gastroenterol. Jun 7, 2019; 25(21): 2650-2664
Published online Jun 7, 2019. doi: 10.3748/wjg.v25.i21.2650
Published online Jun 7, 2019. doi: 10.3748/wjg.v25.i21.2650
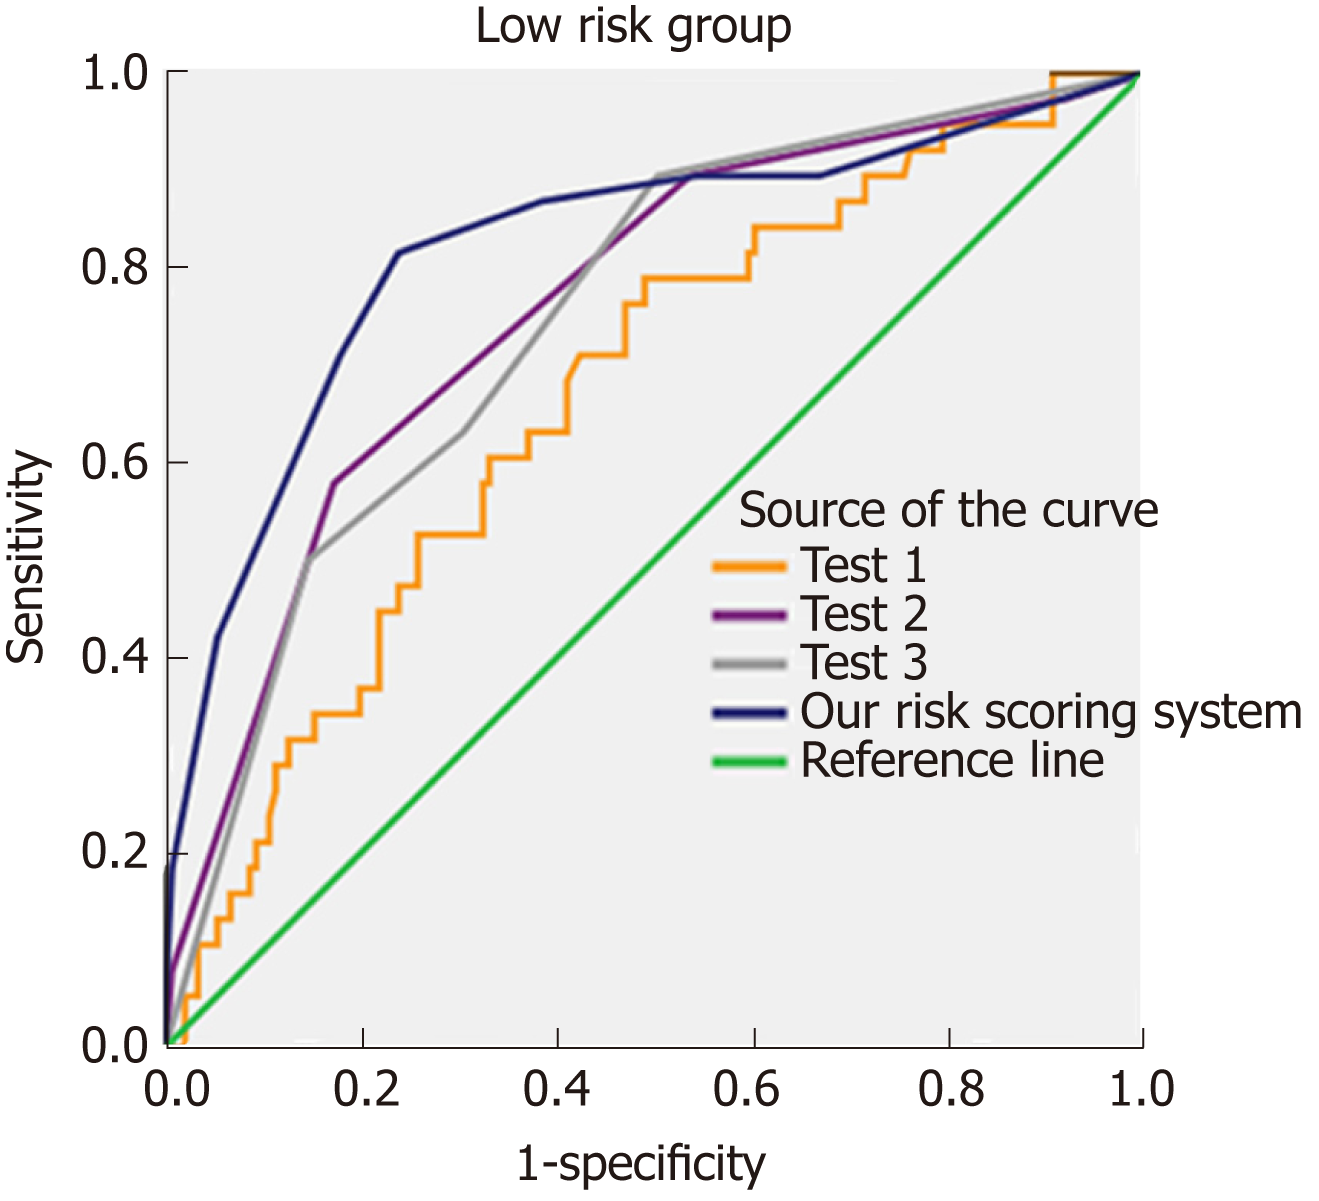
Figure 4 Comparison with three other predictive scoring tools (Test1, Test2, and Test3).
The area under the curve (AUC) of Test1 was 0.688 [95% confidence interval (CI): 0.575-0.762]. The AUC of Test2 was 0.760 (95%CI: 0.675-0.846). The AUC of Test3 was 0.749 (95%CI: 0.665-0.833). The AUC of our risk scoring system was 0.824 (95%CI: 0.759-0.889). AUC: Area under the curve; CI: Confidence interval.
- Citation: Li Y, Zhou F, Zhu DM, Zhang ZX, Yang J, Yao J, Wei YJ, Xu YL, Li DC, Zhou J. Novel risk scoring system for prediction of pancreatic fistula after pancreaticoduodenectomy. World J Gastroenterol 2019; 25(21): 2650-2664
- URL: https://www.wjgnet.com/1007-9327/full/v25/i21/2650.htm
- DOI: https://dx.doi.org/10.3748/wjg.v25.i21.2650


