Copyright
©The Author(s) 2019.
World J Gastroenterol. Jun 7, 2019; 25(21): 2636-2649
Published online Jun 7, 2019. doi: 10.3748/wjg.v25.i21.2636
Published online Jun 7, 2019. doi: 10.3748/wjg.v25.i21.2636
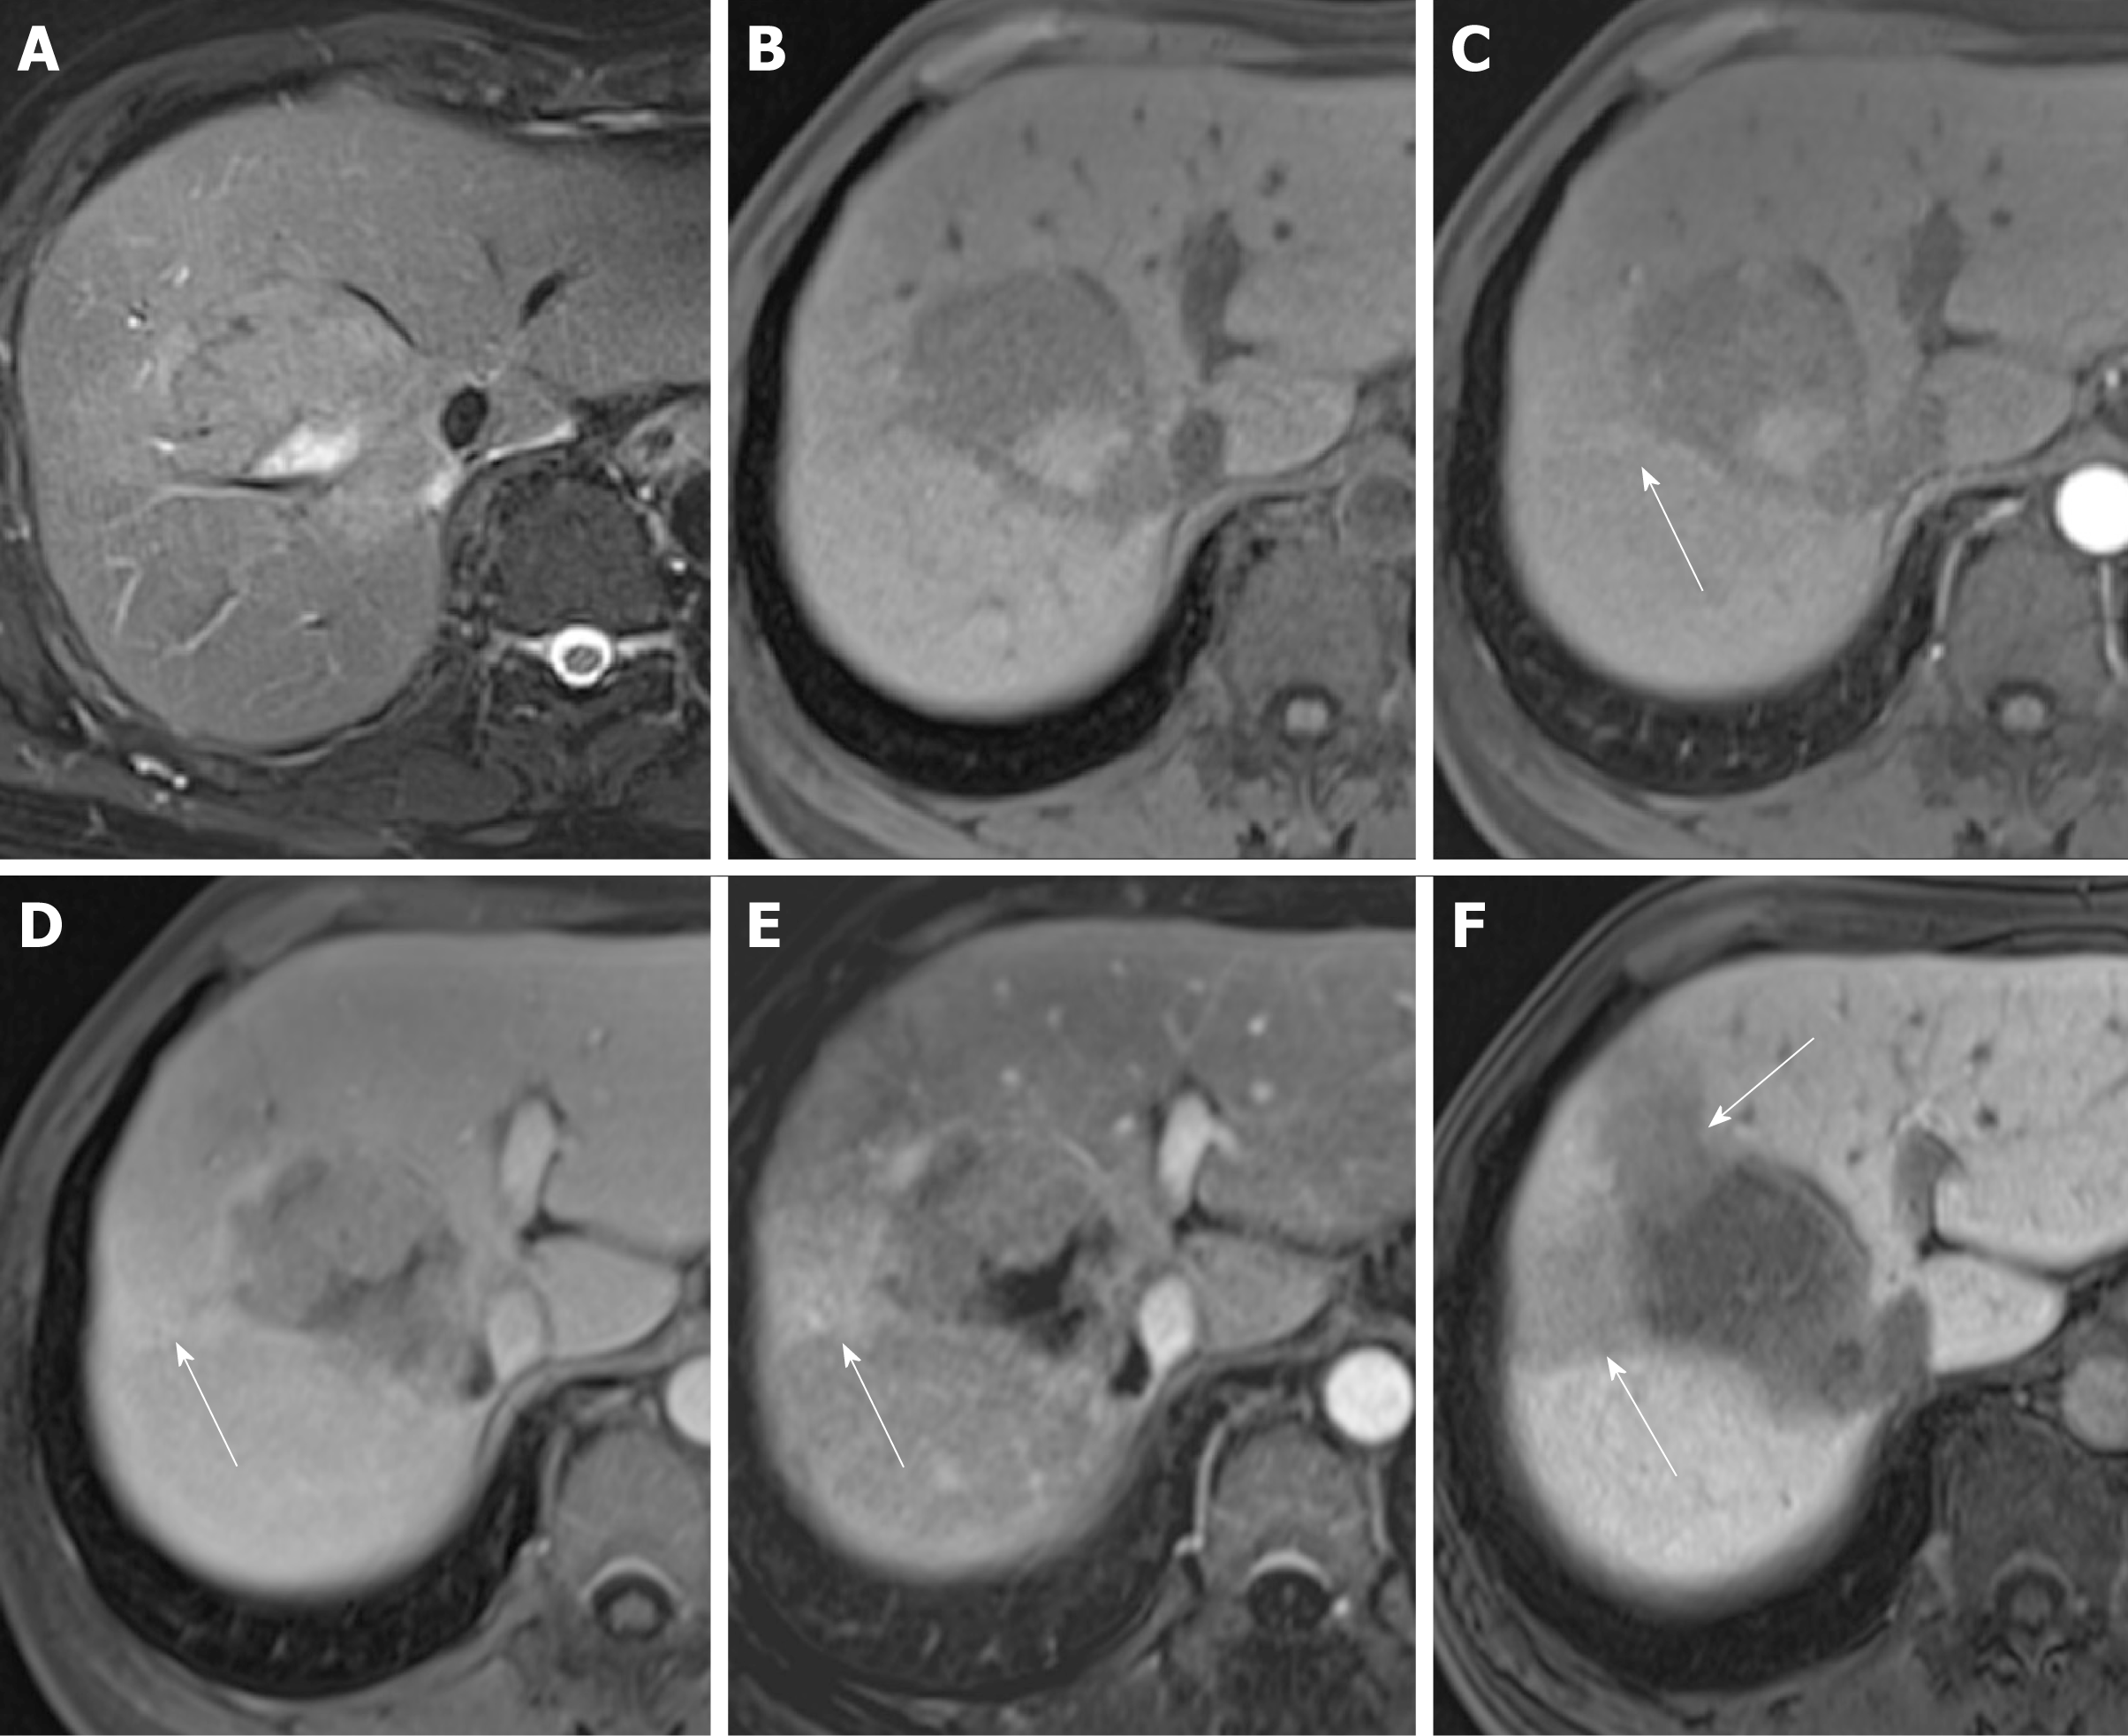
Figure 3 Images in a 64-year-old man with a solitary hepatocellular carcinoma (tumor size 5.
5 cm) in segment VIII. A and B: Axial view of T2- and T1-weighted magnetic resonance images with fat suppression before administration of gadolinium ethoxybenzyl diethylene-triaminepentaacetic acid; C: Arterial phase and D: Portal venous phase showing hyperenhancing mass in segment VIII with partial washout appearance and corona enhancement (arrow); E: Subtracted images of the portal venous phase with more obvious corona enhancement; F: Hepatobiliary phase, T1-weighted three-dimensional gradient-echo magnetic resonance image (axial view) with fat suppression. The obvious flame-like peritumoral hypointensity (arrow) is noted. This tumor was identified postoperatively as a pT2 hepatocellular carcinoma owing to its microvascular invasion.
- Citation: Chou YC, Lao IH, Hsieh PL, Su YY, Mak CW, Sun DP, Sheu MJ, Kuo HT, Chen TJ, Ho CH, Kuo YT. Gadoxetic acid-enhanced magnetic resonance imaging can predict the pathologic stage of solitary hepatocellular carcinoma. World J Gastroenterol 2019; 25(21): 2636-2649
- URL: https://www.wjgnet.com/1007-9327/full/v25/i21/2636.htm
- DOI: https://dx.doi.org/10.3748/wjg.v25.i21.2636


