Copyright
©The Author(s) 2019.
World J Gastroenterol. May 28, 2019; 25(20): 2503-2513
Published online May 28, 2019. doi: 10.3748/wjg.v25.i20.2503
Published online May 28, 2019. doi: 10.3748/wjg.v25.i20.2503
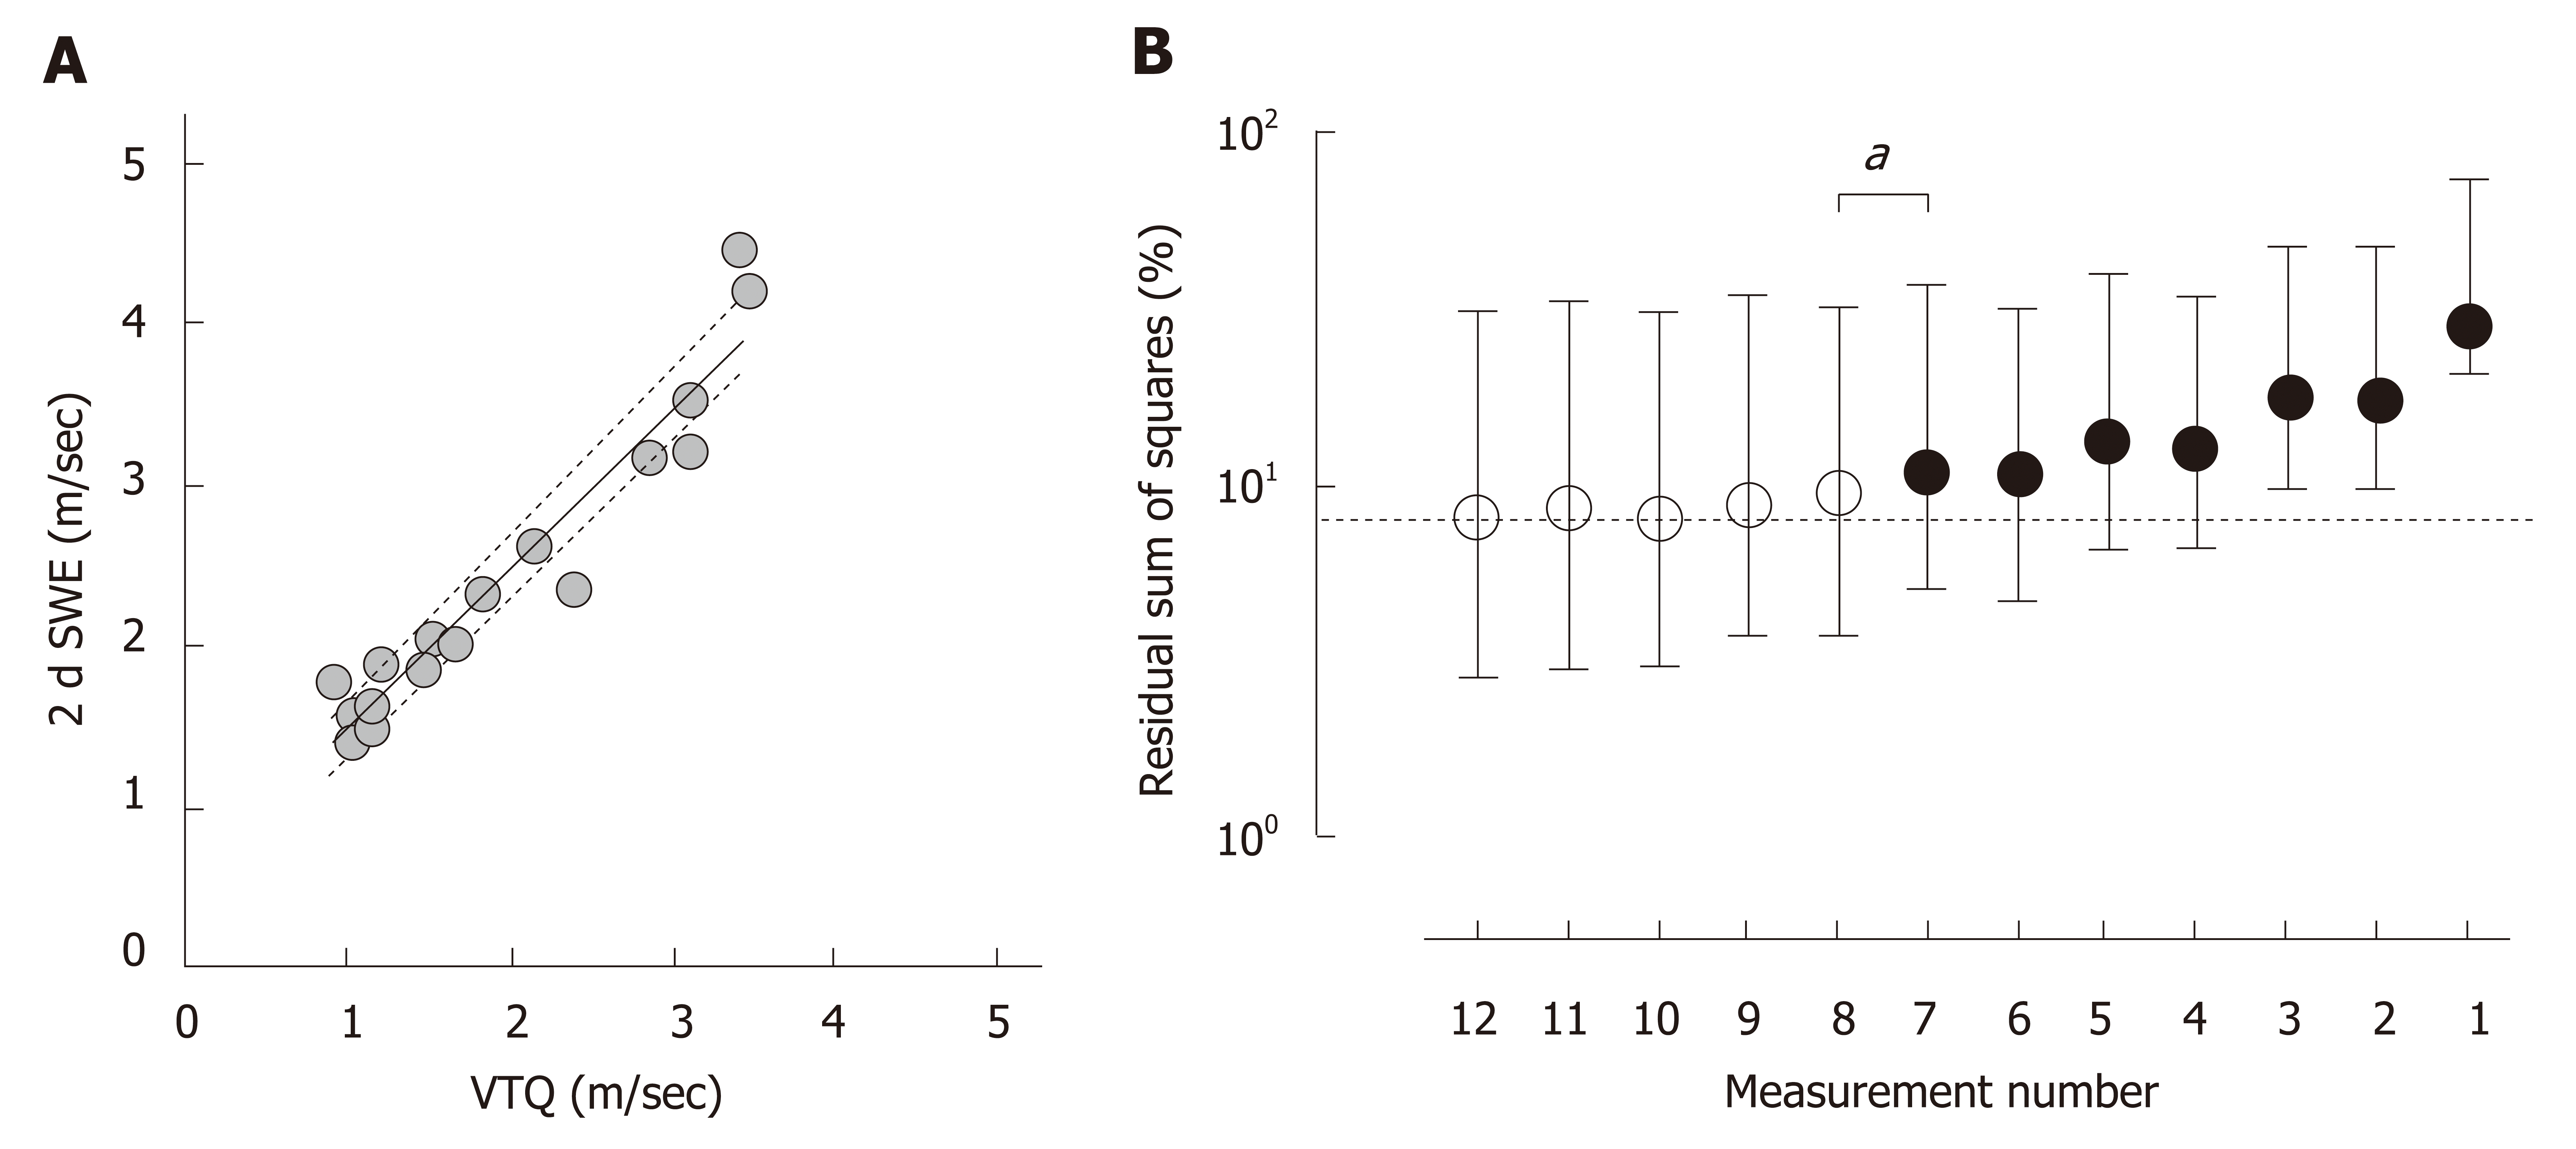
Figure 3 Deviation from an ideal shear wave speed.
A: Virtual touch quantification (VTQ) and 2-dimensional shear wave elastography (2dSWE) were measured on the same day in 18 cases and were significantly correlated with each other (P < 0.0001, r = 0.95). The bold and dotted lines indicate the best hit and 95% confidence bands based on the linear regression model of least-squares. b. A residual sum of squares (%Σdi2) was calculated using 1000 bootstrap resamples with the assumption of measuring the VTQ at 12 sites or fewer in each case and expressed as a percentage against a calculated value from the VTQ based on the linear regression model of least-squares between VTQ and 2dSWE. %Σdi2 increased as the number of acquisition sites were decreased, and the difference of %Σdi2 from that in 12 measurements reached significance as the number of acquisition sites decreased to 7 (bP = 0.027). Circles and horizontal bars indicate medians and interquartile ranges of %Σdi2, respectively. The dotted horizontal line indicates a %Σdi2 of 8.0% in 12 measurements.
- Citation: Yokoo T, Kanefuji T, Suda T, Nagayama I, Hoshi T, Abe S, Morita S, Kamimura H, Kamimura K, Tsuchiya A, Takamura M, Yagi K, Terai S. Rational arrangement of measuring shear wave speed in the liver. World J Gastroenterol 2019; 25(20): 2503-2513
- URL: https://www.wjgnet.com/1007-9327/full/v25/i20/2503.htm
- DOI: https://dx.doi.org/10.3748/wjg.v25.i20.2503


