Copyright
©The Author(s) 2019.
World J Gastroenterol. May 28, 2019; 25(20): 2503-2513
Published online May 28, 2019. doi: 10.3748/wjg.v25.i20.2503
Published online May 28, 2019. doi: 10.3748/wjg.v25.i20.2503
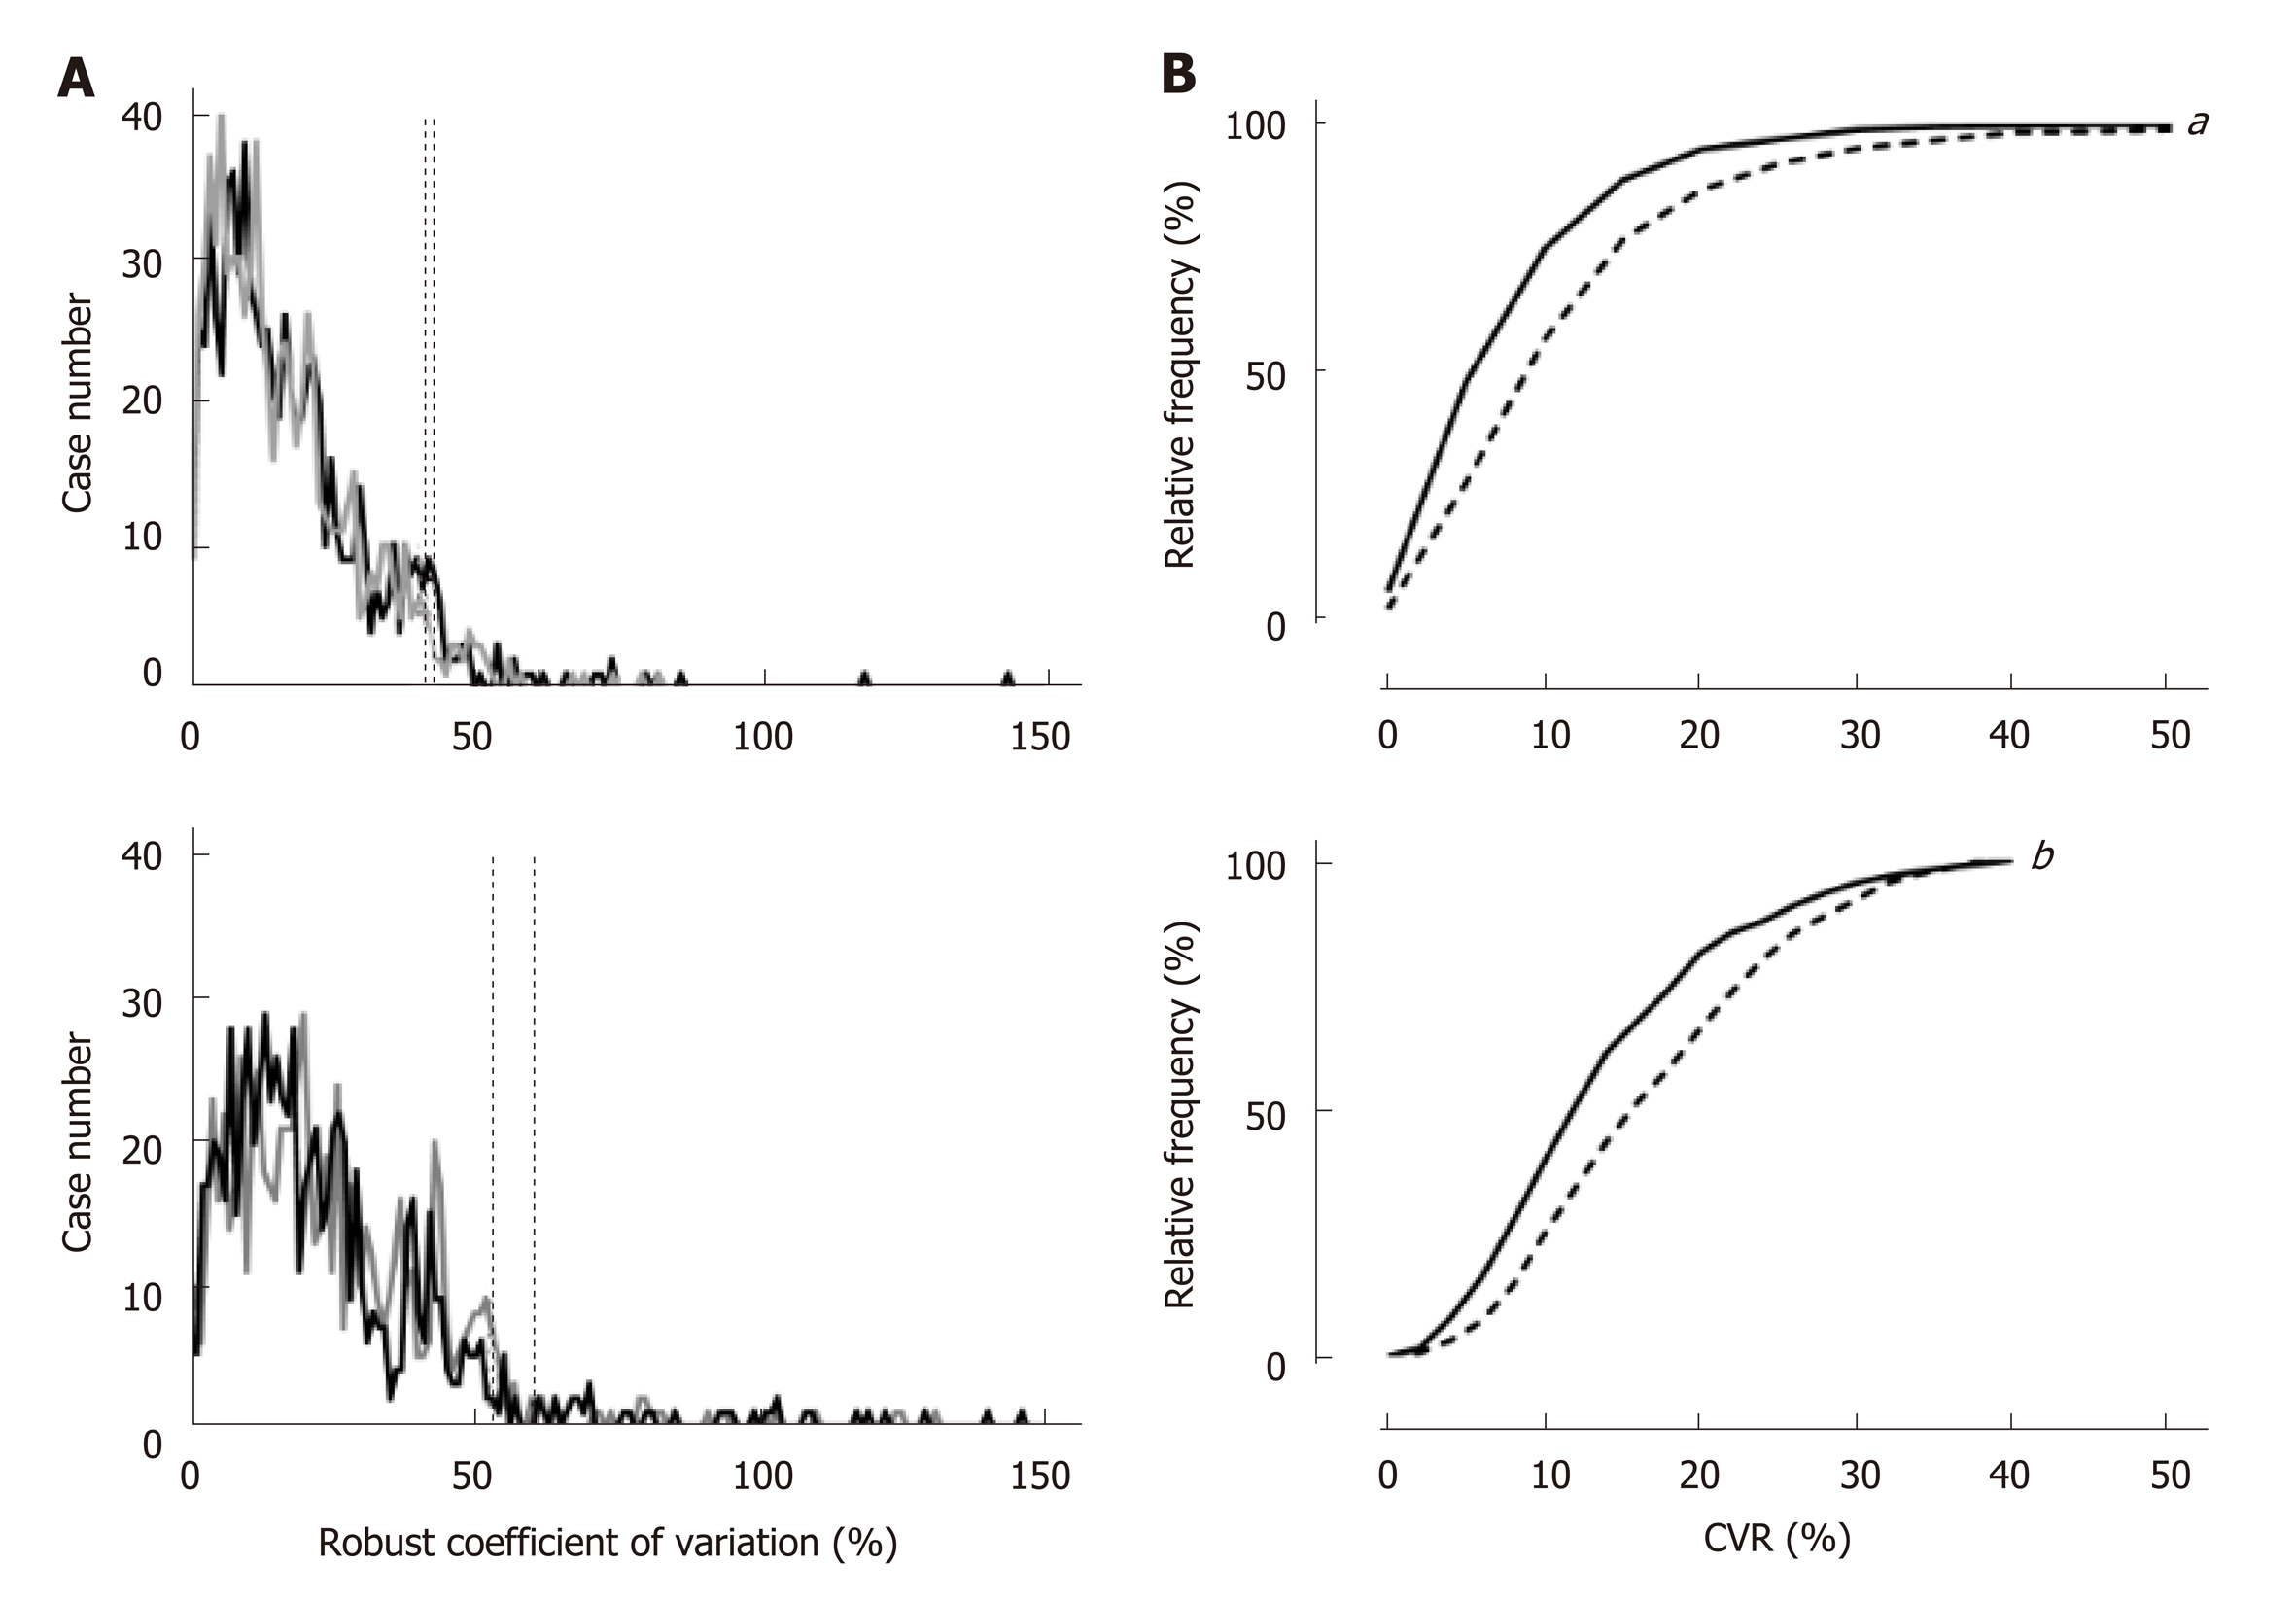
Figure 1 Distribution of robust coefficient-of-variation among the cases.
A: As shown in the upper panel, the lowest coefficient-of-variation (CVR) that covers 95% of cases was 42.1% (black dotted line) and 40.4% (gray dotted line) in right posterior (black line) and anterior segments (gray line), respectively, while the lower panel shows that 60.4% (black dotted line) and 52.8% (gray dotted line) of the CVR are required in the left medial (black line) and lateral (gray dotted line) segments, respectively. B: The cumulative distribution of the CVR was significantly different between the right (continuous line) and left (dotted line) lobes (upper panel, aP < 0.0001), and there is still a significant difference when the subjects are restricted to cases in which the CVR was 40.4% or less in any segment or lobe (lower panel, bP < 0.0001).
- Citation: Yokoo T, Kanefuji T, Suda T, Nagayama I, Hoshi T, Abe S, Morita S, Kamimura H, Kamimura K, Tsuchiya A, Takamura M, Yagi K, Terai S. Rational arrangement of measuring shear wave speed in the liver. World J Gastroenterol 2019; 25(20): 2503-2513
- URL: https://www.wjgnet.com/1007-9327/full/v25/i20/2503.htm
- DOI: https://dx.doi.org/10.3748/wjg.v25.i20.2503


