Copyright
©The Author(s) 2019.
World J Gastroenterol. May 28, 2019; 25(20): 2489-2502
Published online May 28, 2019. doi: 10.3748/wjg.v25.i20.2489
Published online May 28, 2019. doi: 10.3748/wjg.v25.i20.2489
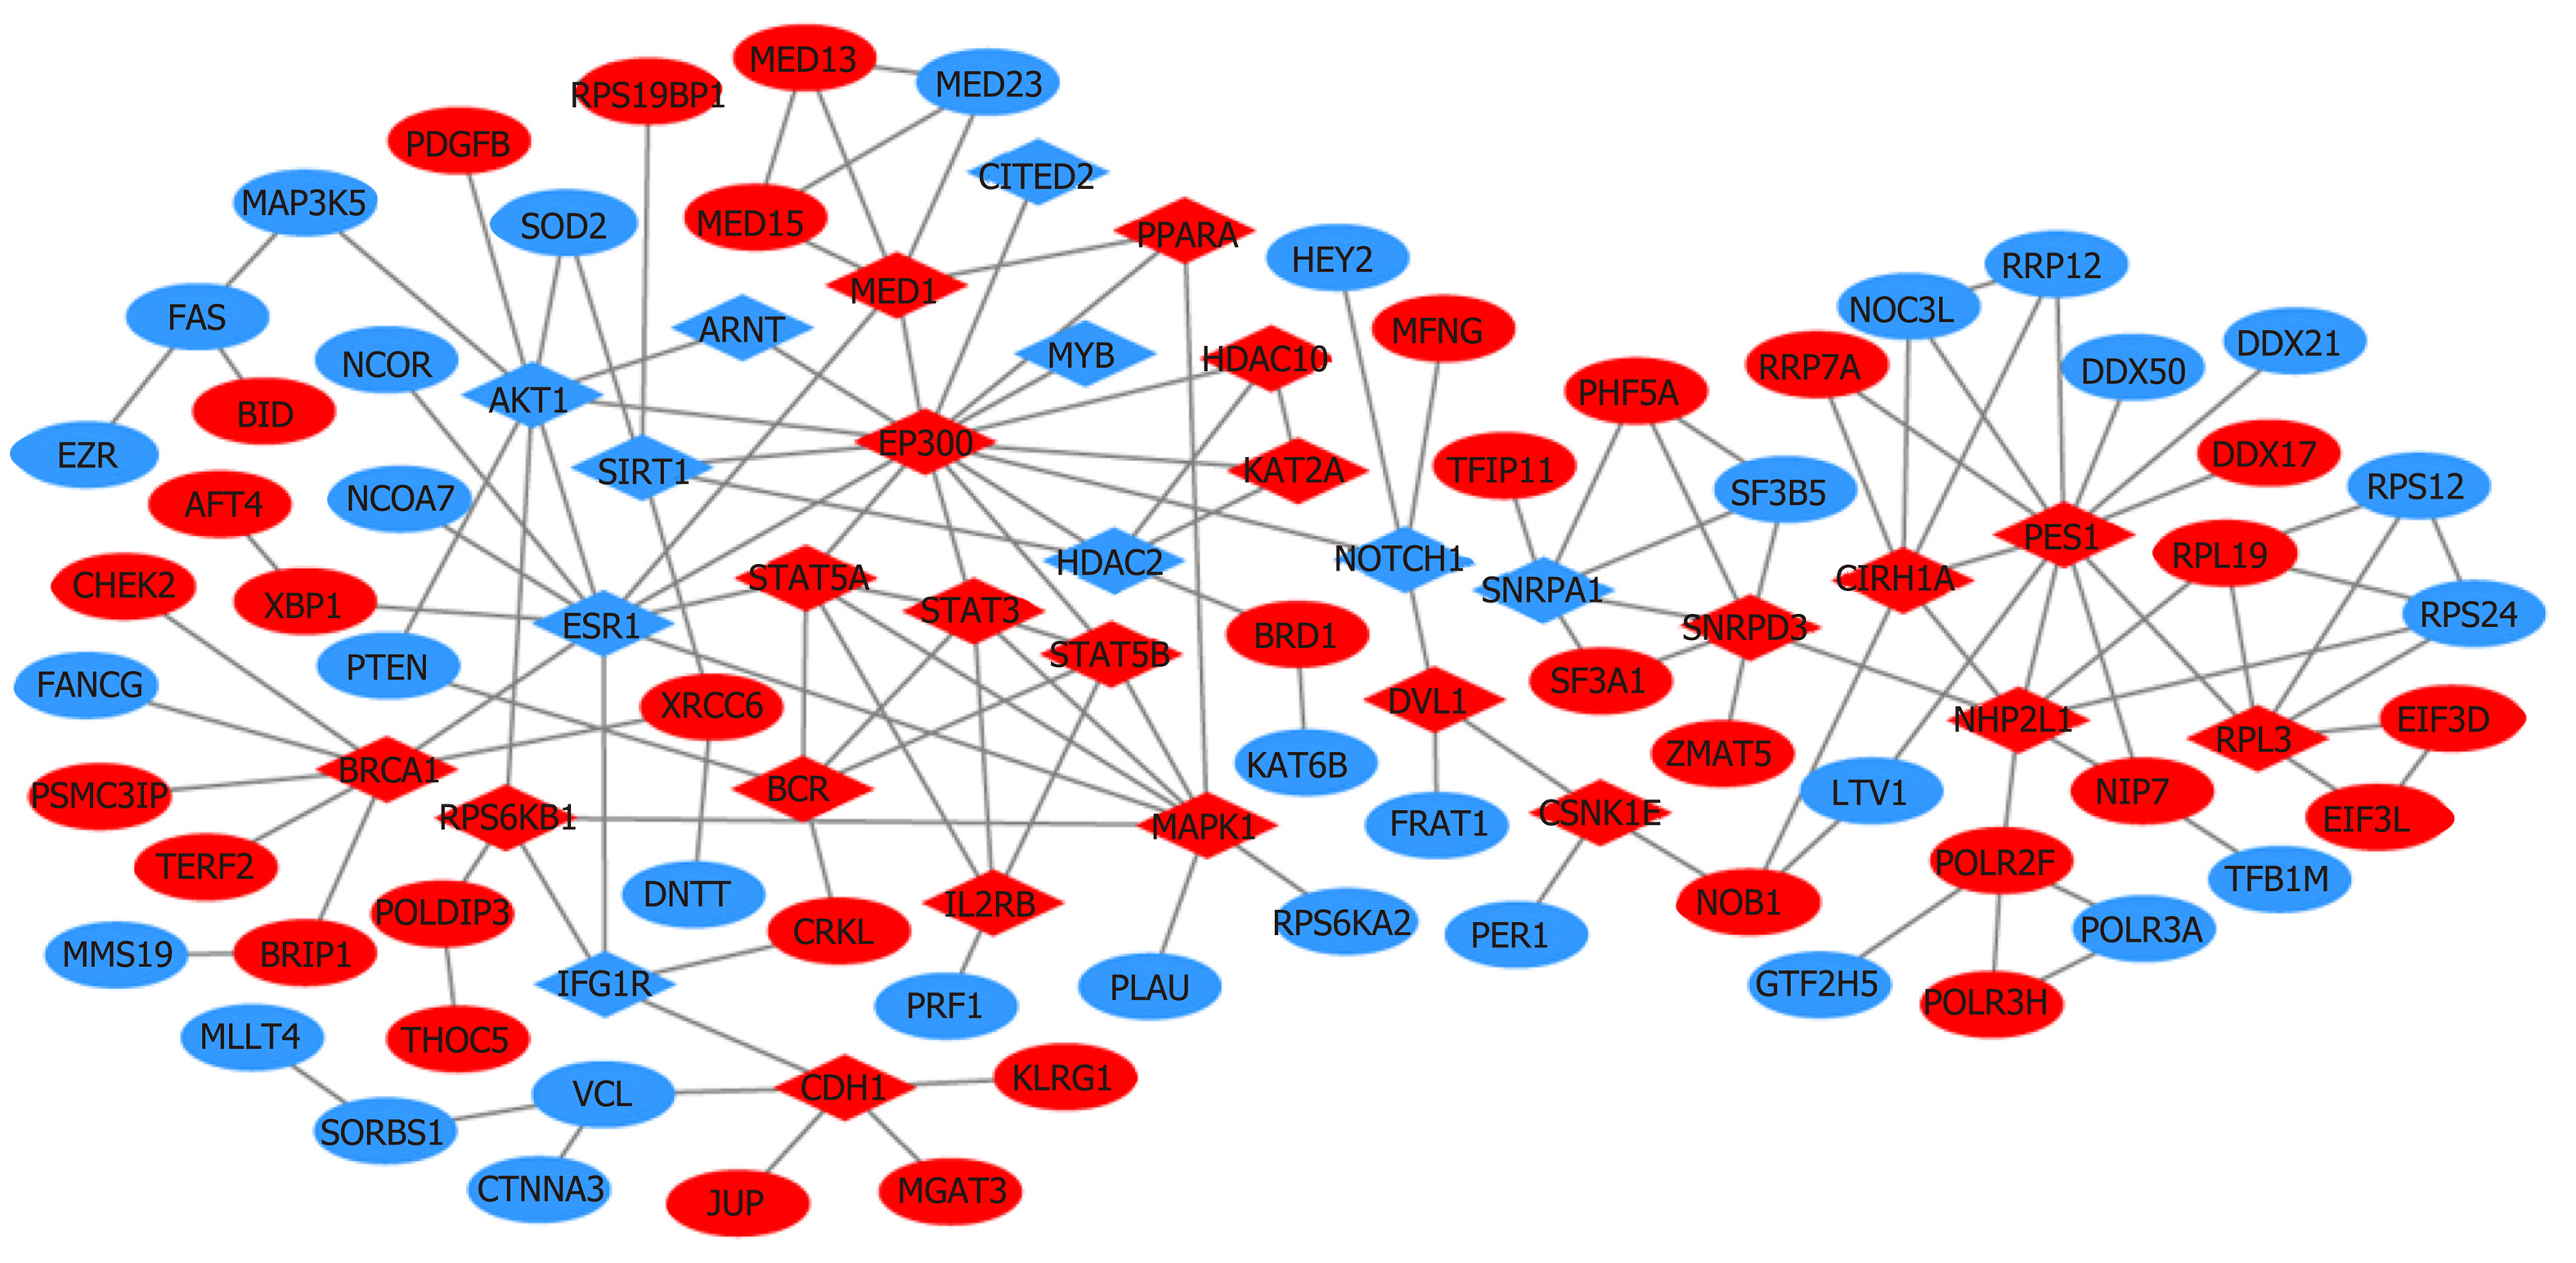
Figure 6 Protein‑protein interaction network for the genes related to lymphovascular invasion (confidence score > 0.
95). Blue represents gain of expression; red represents loss of expression. Diamonds represent the 31 hug genes identified by closeness, degree, and eigenvector.
- Citation: Jiang HH, Zhang ZY, Wang XY, Tang X, Liu HL, Wang AL, Li HG, Tang EJ, Lin MB. Prognostic significance of lymphovascular invasion in colorectal cancer and its association with genomic alterations. World J Gastroenterol 2019; 25(20): 2489-2502
- URL: https://www.wjgnet.com/1007-9327/full/v25/i20/2489.htm
- DOI: https://dx.doi.org/10.3748/wjg.v25.i20.2489


