Copyright
©The Author(s) 2019.
World J Gastroenterol. Jan 14, 2019; 25(2): 233-244
Published online Jan 14, 2019. doi: 10.3748/wjg.v25.i2.233
Published online Jan 14, 2019. doi: 10.3748/wjg.v25.i2.233
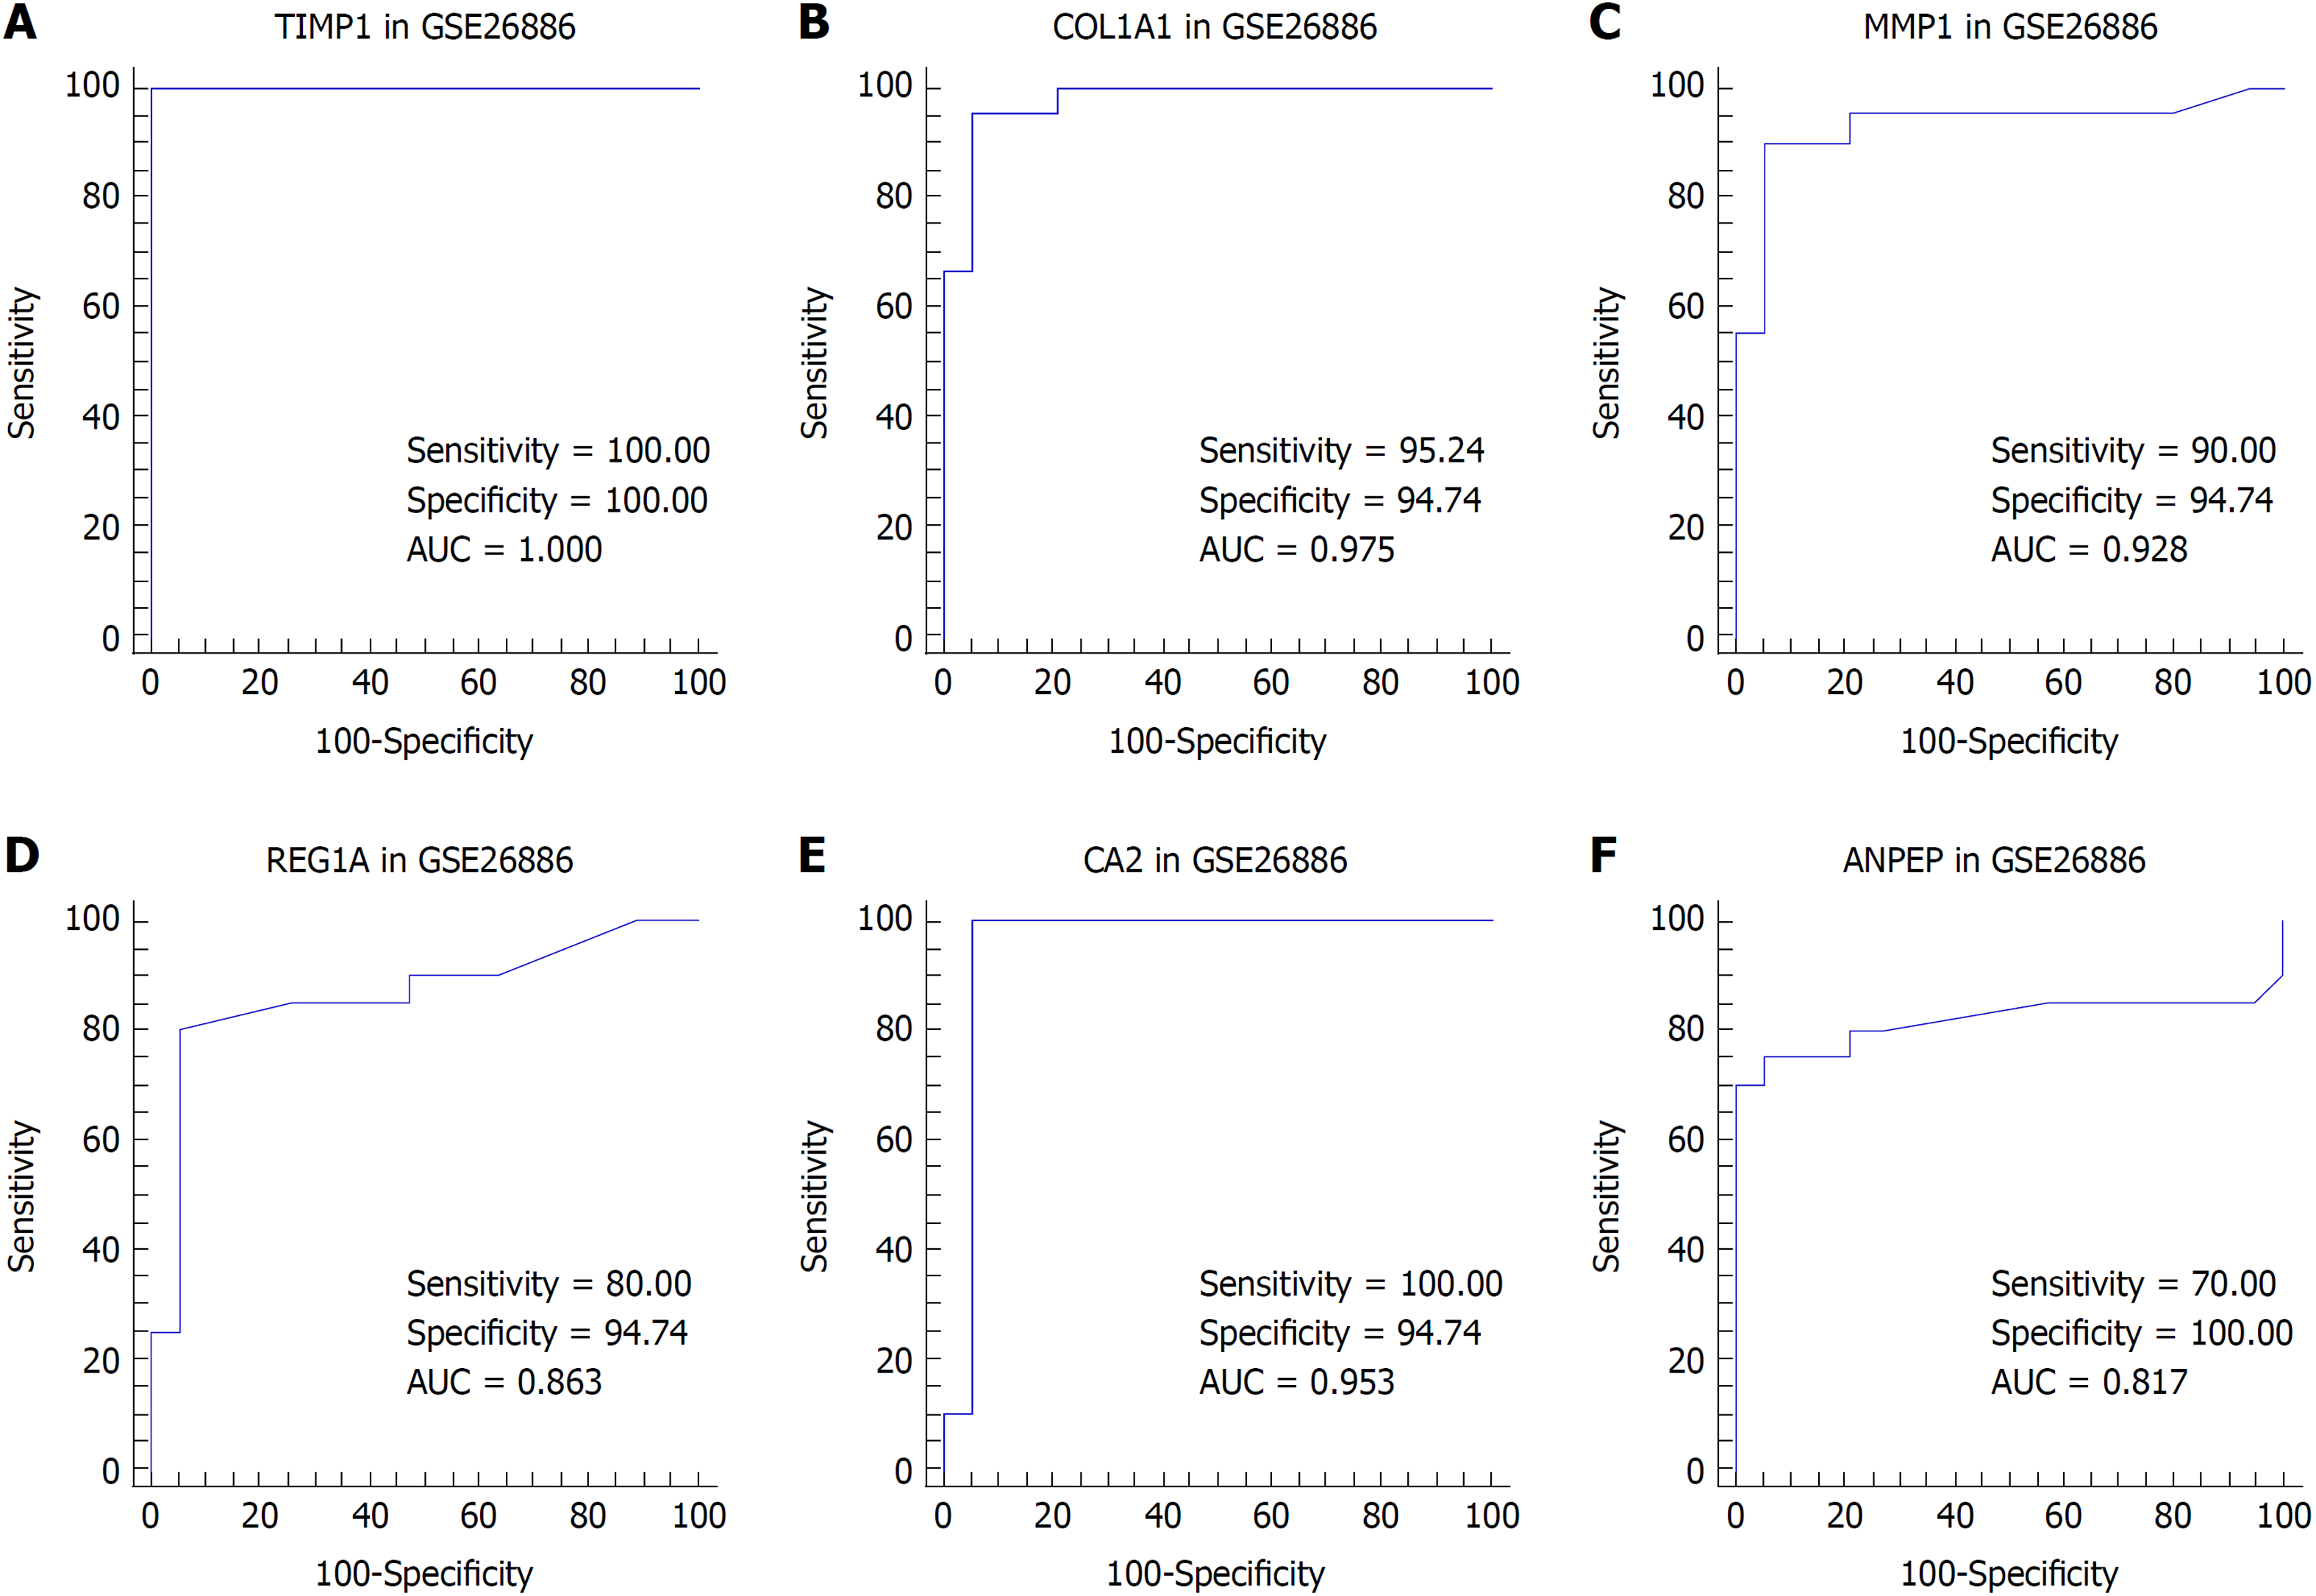
Figure 5 Receiver operating characteristic analysis for tissue discrimination between esophageal adenocarcinoma vs normal esophagus and Barrett's esophagus vs normal esophagus in the GSE26886 dataset.
A: Receiver operating characteristic (ROC) curve of TIMP1; B: ROC curve of COL1A1; C: ROC curve of MMP1; D: ROC curve of REG1A; E: ROC curve of CA2; F: ROC curve of ANPEP.
- Citation: Lv J, Guo L, Wang JH, Yan YZ, Zhang J, Wang YY, Yu Y, Huang YF, Zhao HP. Biomarker identification and trans-regulatory network analyses in esophageal adenocarcinoma and Barrett’s esophagus. World J Gastroenterol 2019; 25(2): 233-244
- URL: https://www.wjgnet.com/1007-9327/full/v25/i2/233.htm
- DOI: https://dx.doi.org/10.3748/wjg.v25.i2.233


