Copyright
©The Author(s) 2019.
World J Gastroenterol. May 21, 2019; 25(19): 2365-2372
Published online May 21, 2019. doi: 10.3748/wjg.v25.i19.2365
Published online May 21, 2019. doi: 10.3748/wjg.v25.i19.2365
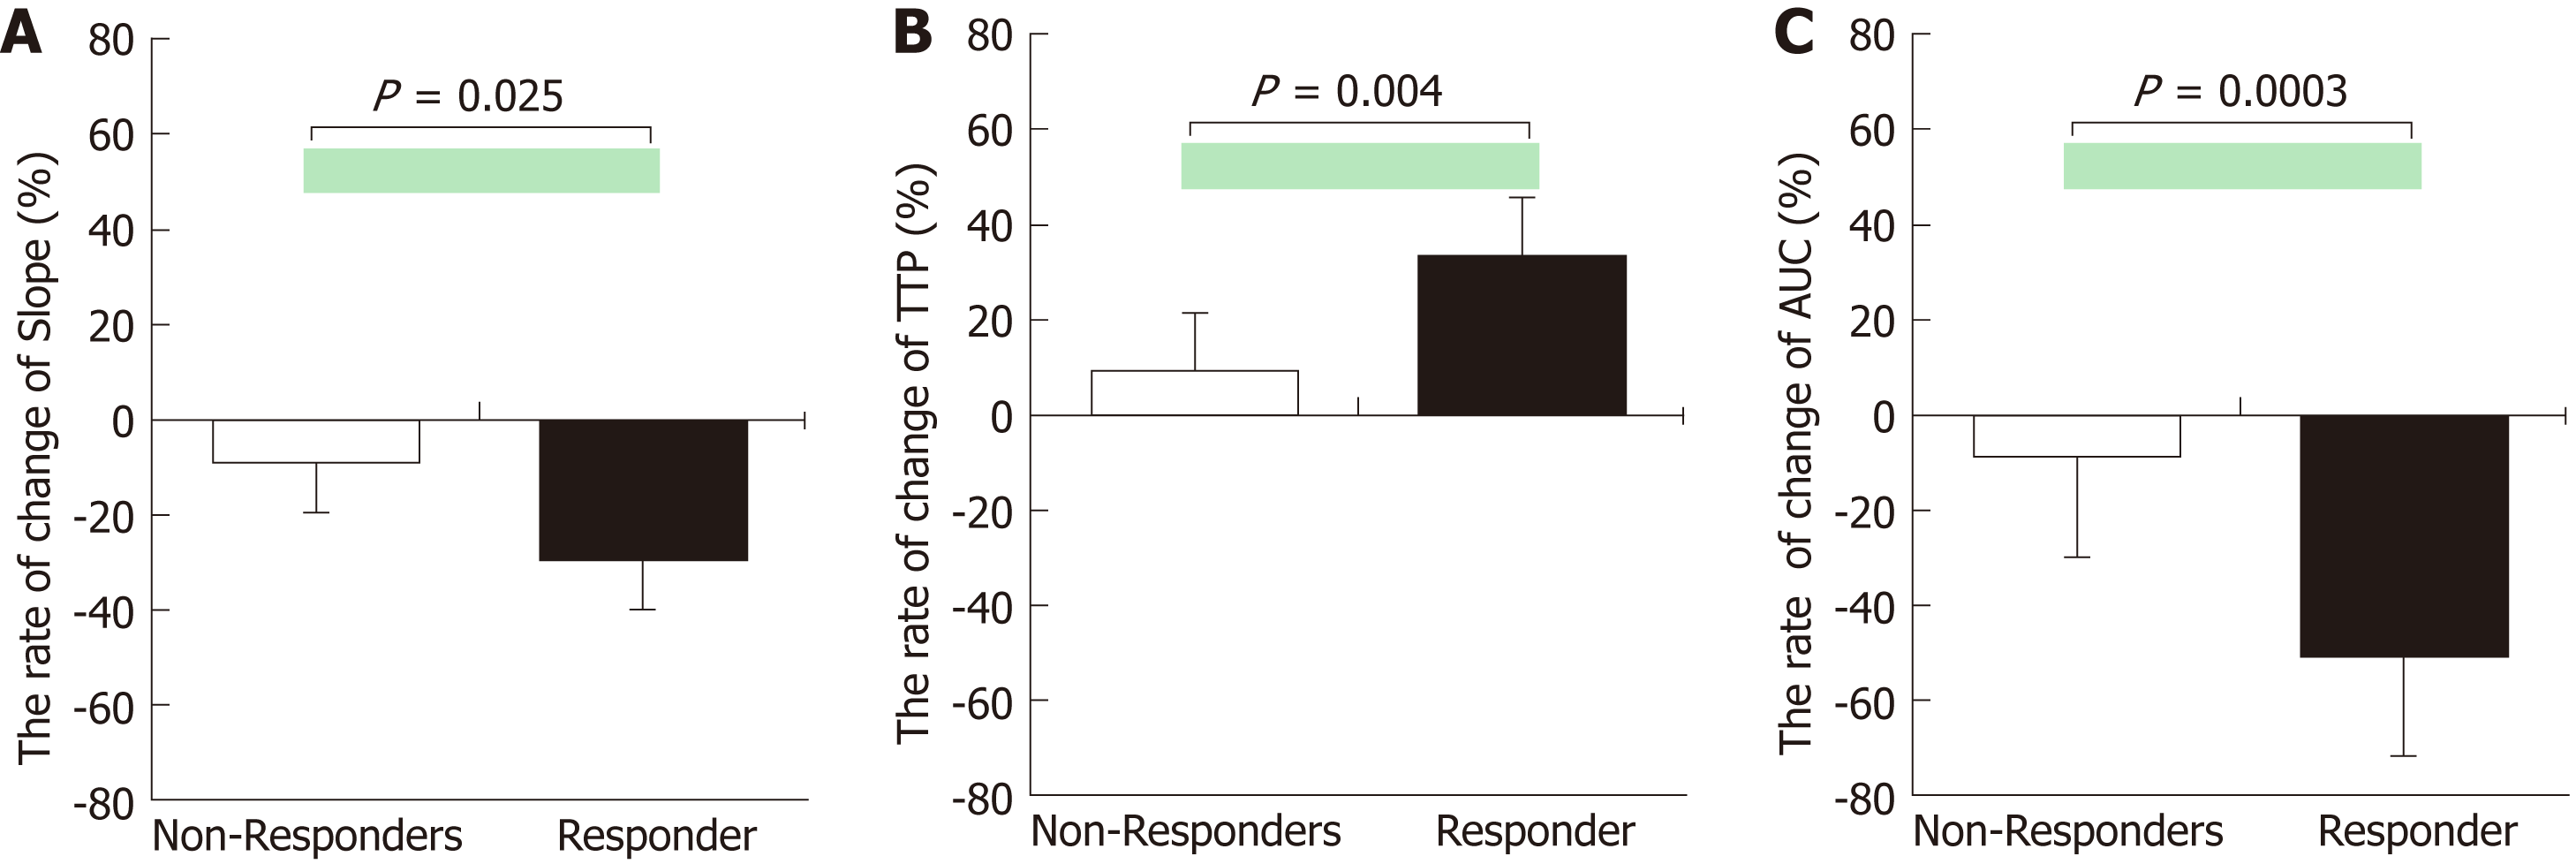
Figure 2 The rates of change of time-intensity curve parameters in responders and non-responders.
A: Slope, B: time to peak, C: area under the curve. The rates of change of all time-intensity curve parameters were significantly different in responders and non-responders. TTP: Time to peak; AUC: Area under the curve.
- Citation: Kuorda H, Abe T, Fujiwara Y, Okamoto T, Yonezawa M, Sato H, Endo K, Oikawa T, Sawara K, Takikawa Y. Change in arterial tumor perfusion is an early biomarker of lenvatinib efficacy in patients with unresectable hepatocellular carcinoma. World J Gastroenterol 2019; 25(19): 2365-2372
- URL: https://www.wjgnet.com/1007-9327/full/v25/i19/2365.htm
- DOI: https://dx.doi.org/10.3748/wjg.v25.i19.2365


