Copyright
©The Author(s) 2019.
World J Gastroenterol. May 14, 2019; 25(18): 2204-2216
Published online May 14, 2019. doi: 10.3748/wjg.v25.i18.2204
Published online May 14, 2019. doi: 10.3748/wjg.v25.i18.2204
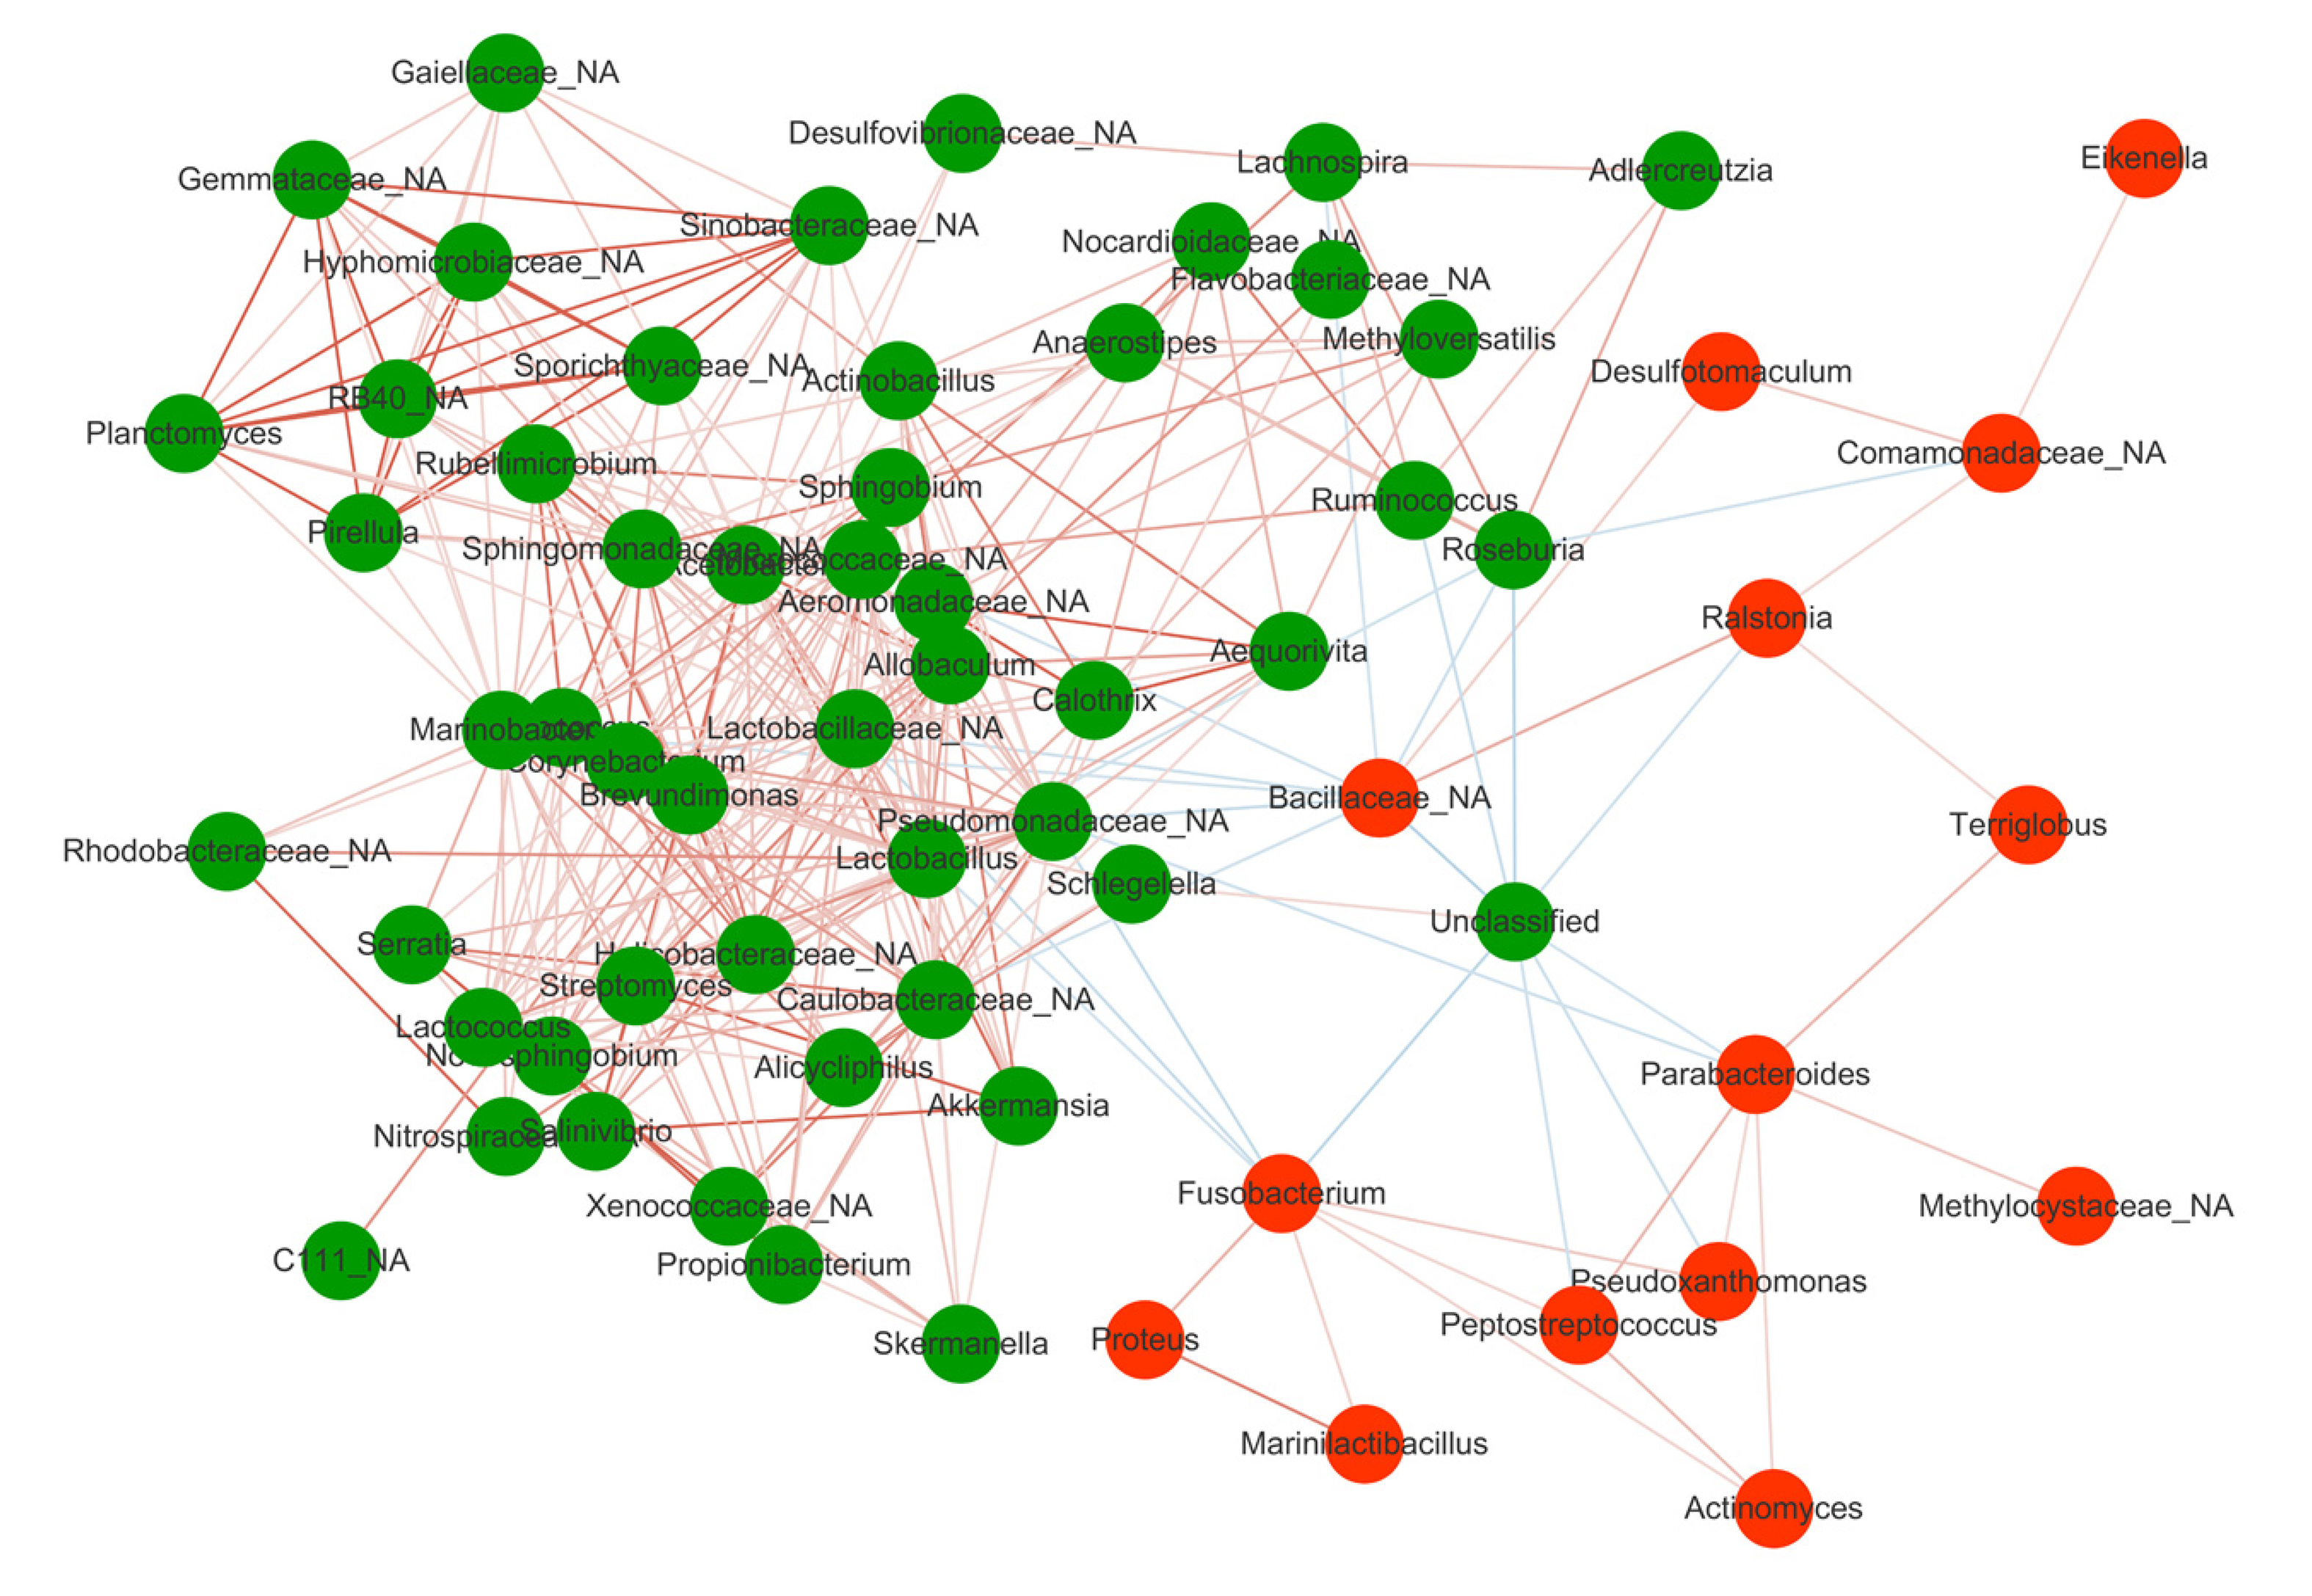
Figure 3 Spearman correlations among the 65 Crohn’s disease-associated genera in gut mucosal samples.
The green circle represented taxa enriched in patients after treatment while the red circle represented taxa enriched in patients before treatment. Lines between nodes denoted Pearson correlation (r > 0.2 and P < 0.05). The red and blue lines represented the positive and negative correlation, respectively.
- Citation: He C, Wang H, Liao WD, Peng C, Shu X, Zhu X, Zhu ZH. Characteristics of mucosa-associated gut microbiota during treatment in Crohn’s disease. World J Gastroenterol 2019; 25(18): 2204-2216
- URL: https://www.wjgnet.com/1007-9327/full/v25/i18/2204.htm
- DOI: https://dx.doi.org/10.3748/wjg.v25.i18.2204


