Copyright
©The Author(s) 2019.
World J Gastroenterol. May 7, 2019; 25(17): 2086-2098
Published online May 7, 2019. doi: 10.3748/wjg.v25.i17.2086
Published online May 7, 2019. doi: 10.3748/wjg.v25.i17.2086
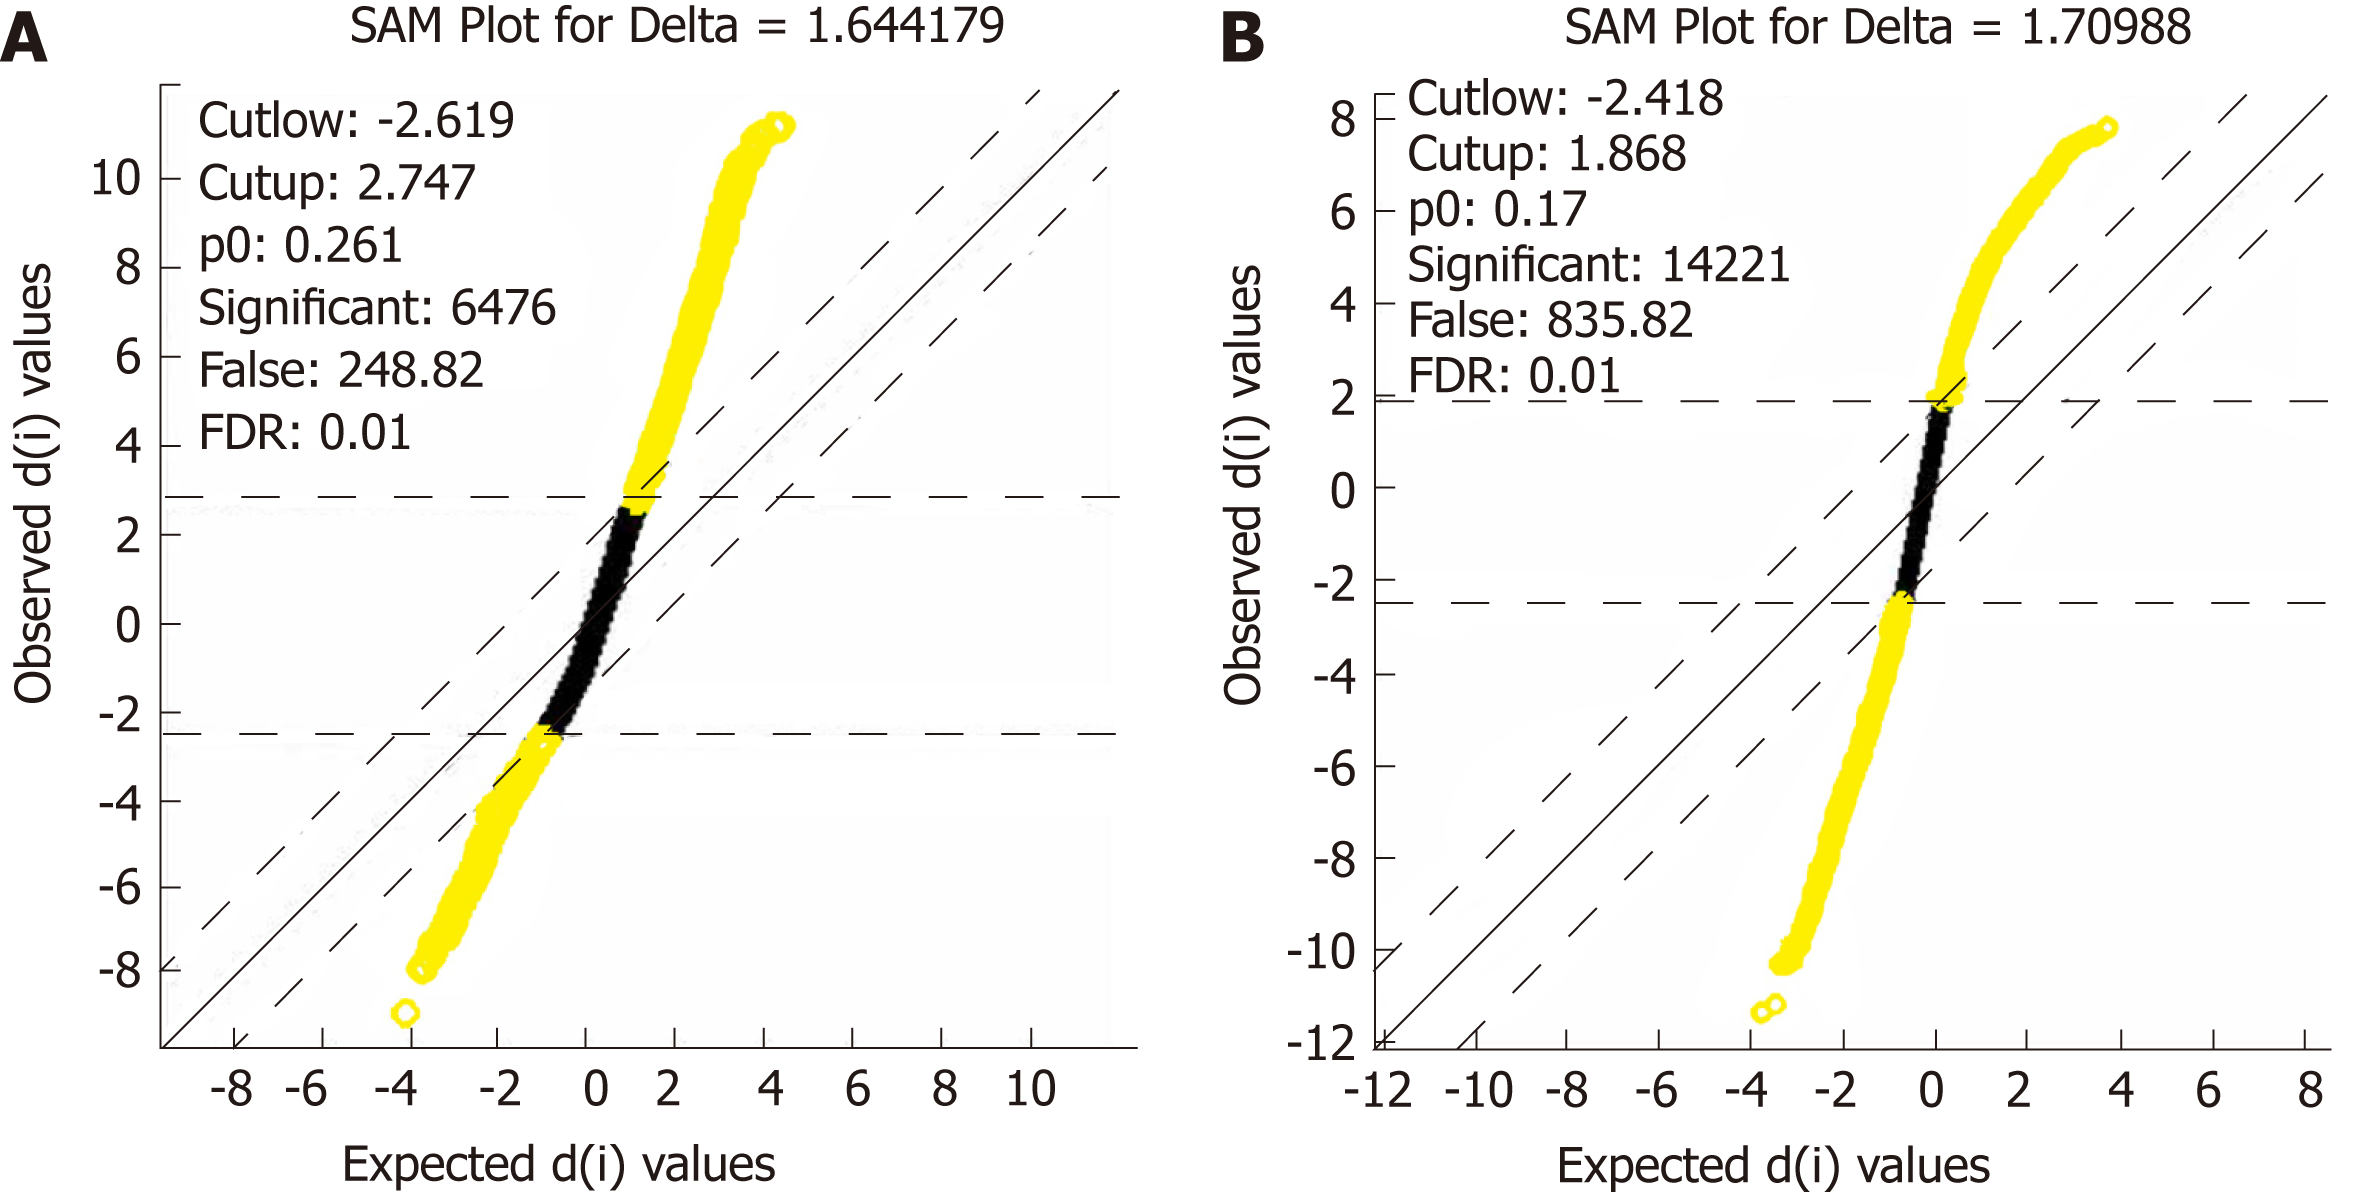
Figure 2 Distribution diagram of the statistical analysis of gene expression.
A: Distribution diagram of the statistical analysis of gene expression after the extraction of differentially expressed genes in set GSE16515; B: Distribution diagram of the statistical analysis of gene expression after the extraction of differentially expressed genes in set GSE15471. Yellow for differentially expressed genes and black for non-differentially expressed genes.
- Citation: Yang YH, Zhang YX, Gui Y, Liu JB, Sun JJ, Fan H. Analysis of the autophagy gene expression profile of pancreatic cancer based on autophagy-related protein microtubule-associated protein 1A/1B-light chain 3. World J Gastroenterol 2019; 25(17): 2086-2098
- URL: https://www.wjgnet.com/1007-9327/full/v25/i17/2086.htm
- DOI: https://dx.doi.org/10.3748/wjg.v25.i17.2086


