Copyright
©The Author(s) 2019.
World J Gastroenterol. May 7, 2019; 25(17): 2071-2085
Published online May 7, 2019. doi: 10.3748/wjg.v25.i17.2071
Published online May 7, 2019. doi: 10.3748/wjg.v25.i17.2071
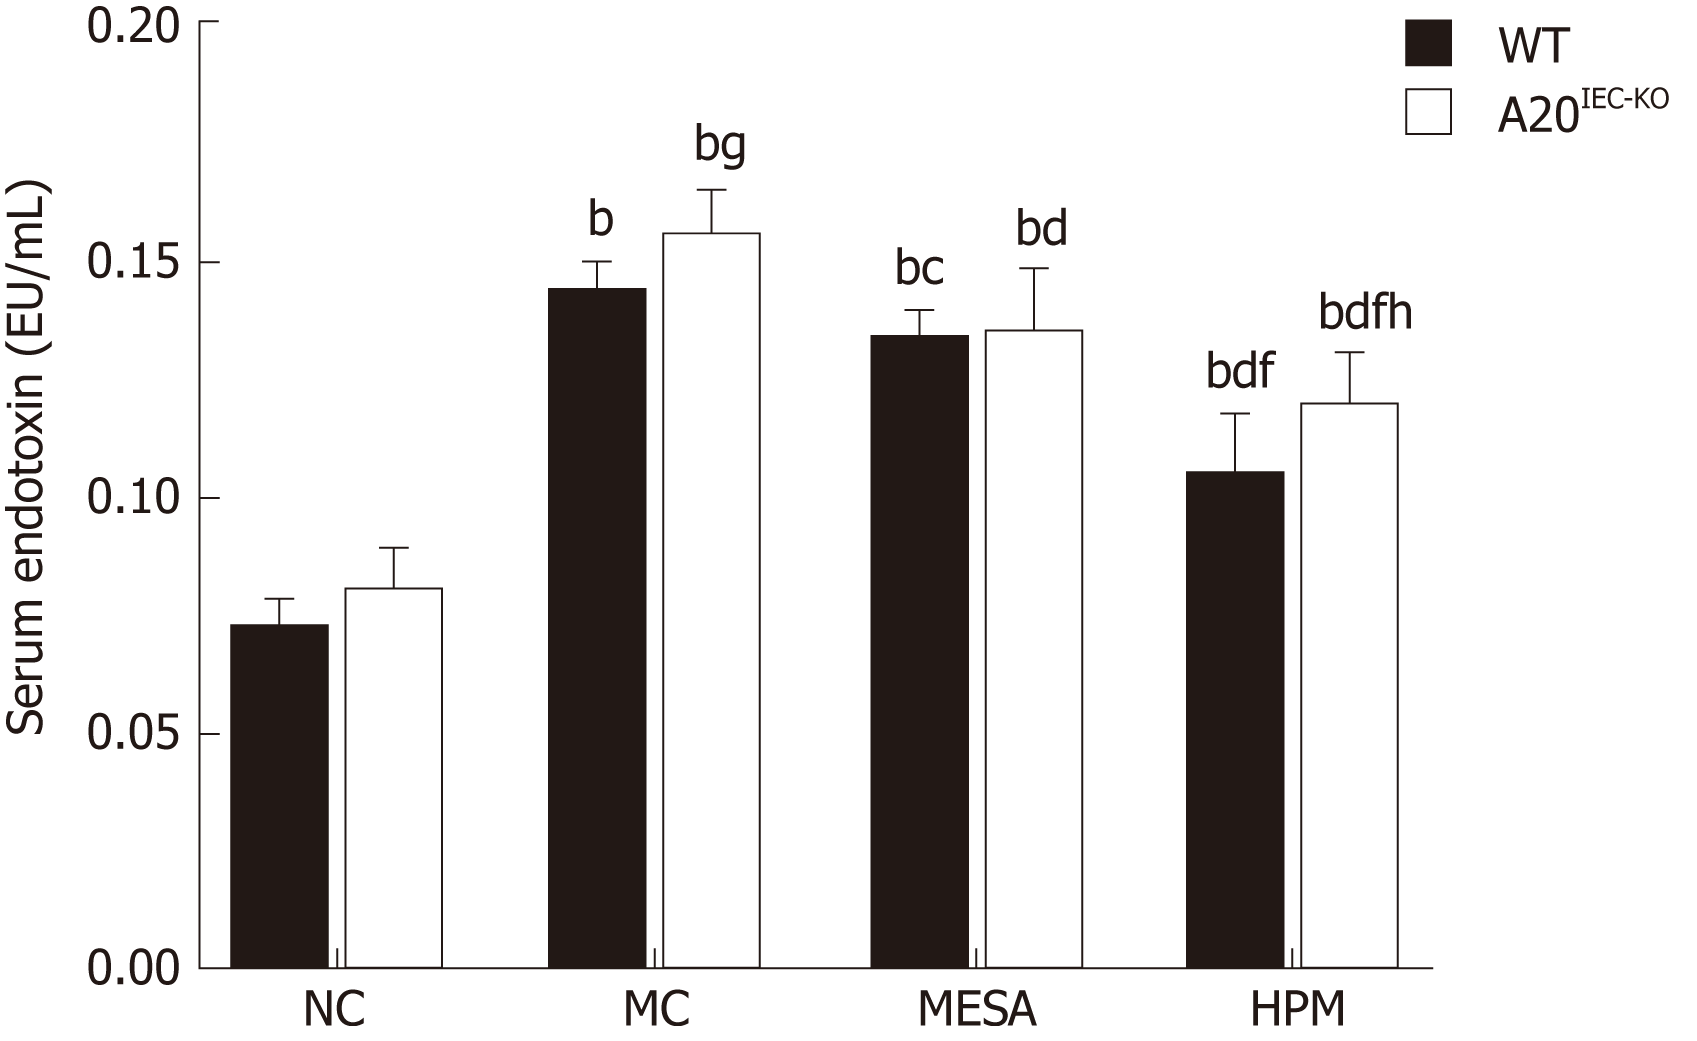
Figure 2 Serum endotoxin levels in mice across groups.
Data are presented as the mean ± standard deviation (n = 10). Data were evaluated for statistical significance by one-way analysis of variance and are represented as follows: aP<0.05, bP < 0.01 as compared to normal control; cP < 0.05, dP < 0.01 as compared to model control; eP < 0.05, fP < 0.01 as compared to mesalazine; gP < 0.05, hP < 0.01 as compared to wild type. WT: Wild type; NC: Normal control; MC: Model control; MESA: Mesalazine; HPM: Herbs-partitioned moxibustion.
- Citation: Zhou J, Wu LY, Chen L, Guo YJ, Sun Y, Li T, Zhao JM, Bao CH, Wu HG, Shi Y. Herbs-partitioned moxibustion alleviates aberrant intestinal epithelial cell apoptosis by upregulating A20 expression in a mouse model of Crohn’s disease. World J Gastroenterol 2019; 25(17): 2071-2085
- URL: https://www.wjgnet.com/1007-9327/full/v25/i17/2071.htm
- DOI: https://dx.doi.org/10.3748/wjg.v25.i17.2071


