Copyright
©The Author(s) 2019.
World J Gastroenterol. Apr 28, 2019; 25(16): 1986-1996
Published online Apr 28, 2019. doi: 10.3748/wjg.v25.i16.1986
Published online Apr 28, 2019. doi: 10.3748/wjg.v25.i16.1986
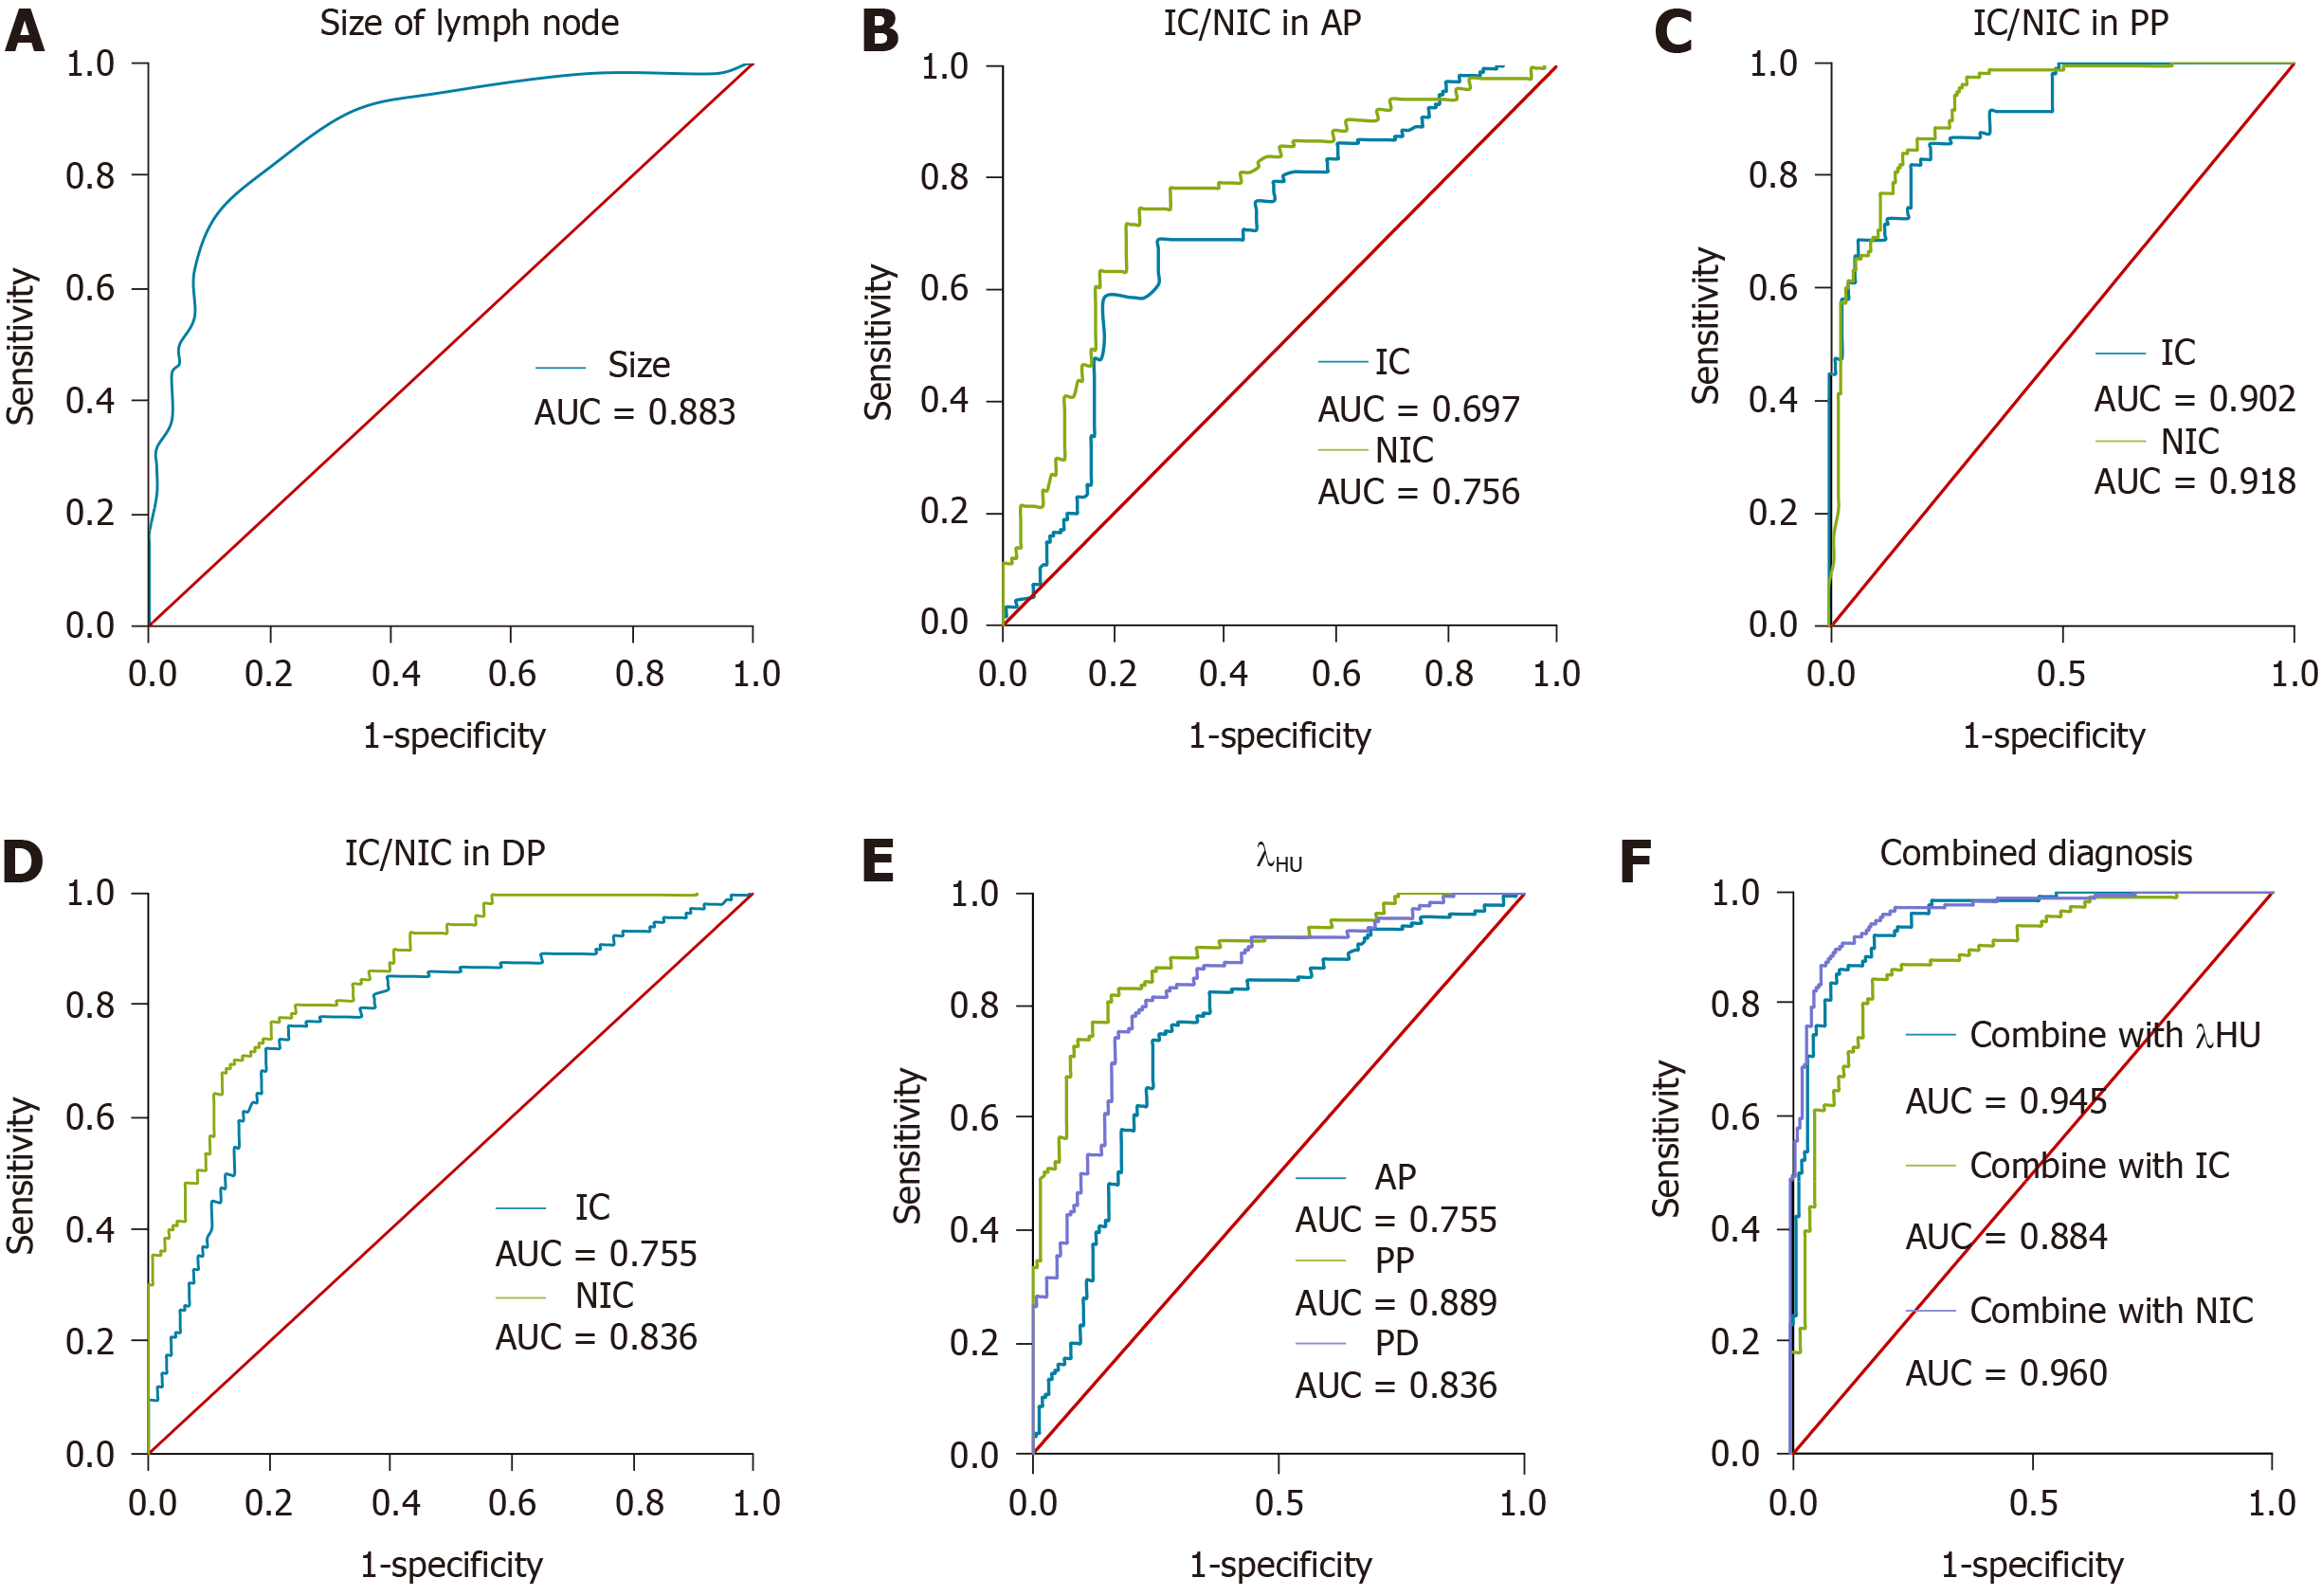
Figure 3 Receiver operating characteristic curve analysis of dual energy computed tomography quantitative parameters for metastatic and non-metastatic lymph nodes.
A: Maximal short axis diameter of lymph nodes; B: Iodine concentration (IC)/normalized IC (NIC) in the arterial phase; C: IC/NIC in the portal phase; D: IC/NIC in the delayed phase; E: Slope of the spectral curve (λHU) in three contrast-enhanced phases; F: Combination of maximal short axis diameter of lymph nodes with λHU, IC, or NIC in the portal phase. IC: Iodine concentration; NIC: Normalized iodine concentration; λHU: Slope of the spectral curve; AP: Arterial phase; PP: Portal phase; DP: Delayed phase.
- Citation: Zeng YR, Yang QH, Liu QY, Min J, Li HG, Liu ZF, Li JX. Dual energy computed tomography for detection of metastatic lymph nodes in patients with hepatocellular carcinoma. World J Gastroenterol 2019; 25(16): 1986-1996
- URL: https://www.wjgnet.com/1007-9327/full/v25/i16/1986.htm
- DOI: https://dx.doi.org/10.3748/wjg.v25.i16.1986


