Copyright
©The Author(s) 2019.
World J Gastroenterol. Apr 28, 2019; 25(16): 1950-1963
Published online Apr 28, 2019. doi: 10.3748/wjg.v25.i16.1950
Published online Apr 28, 2019. doi: 10.3748/wjg.v25.i16.1950
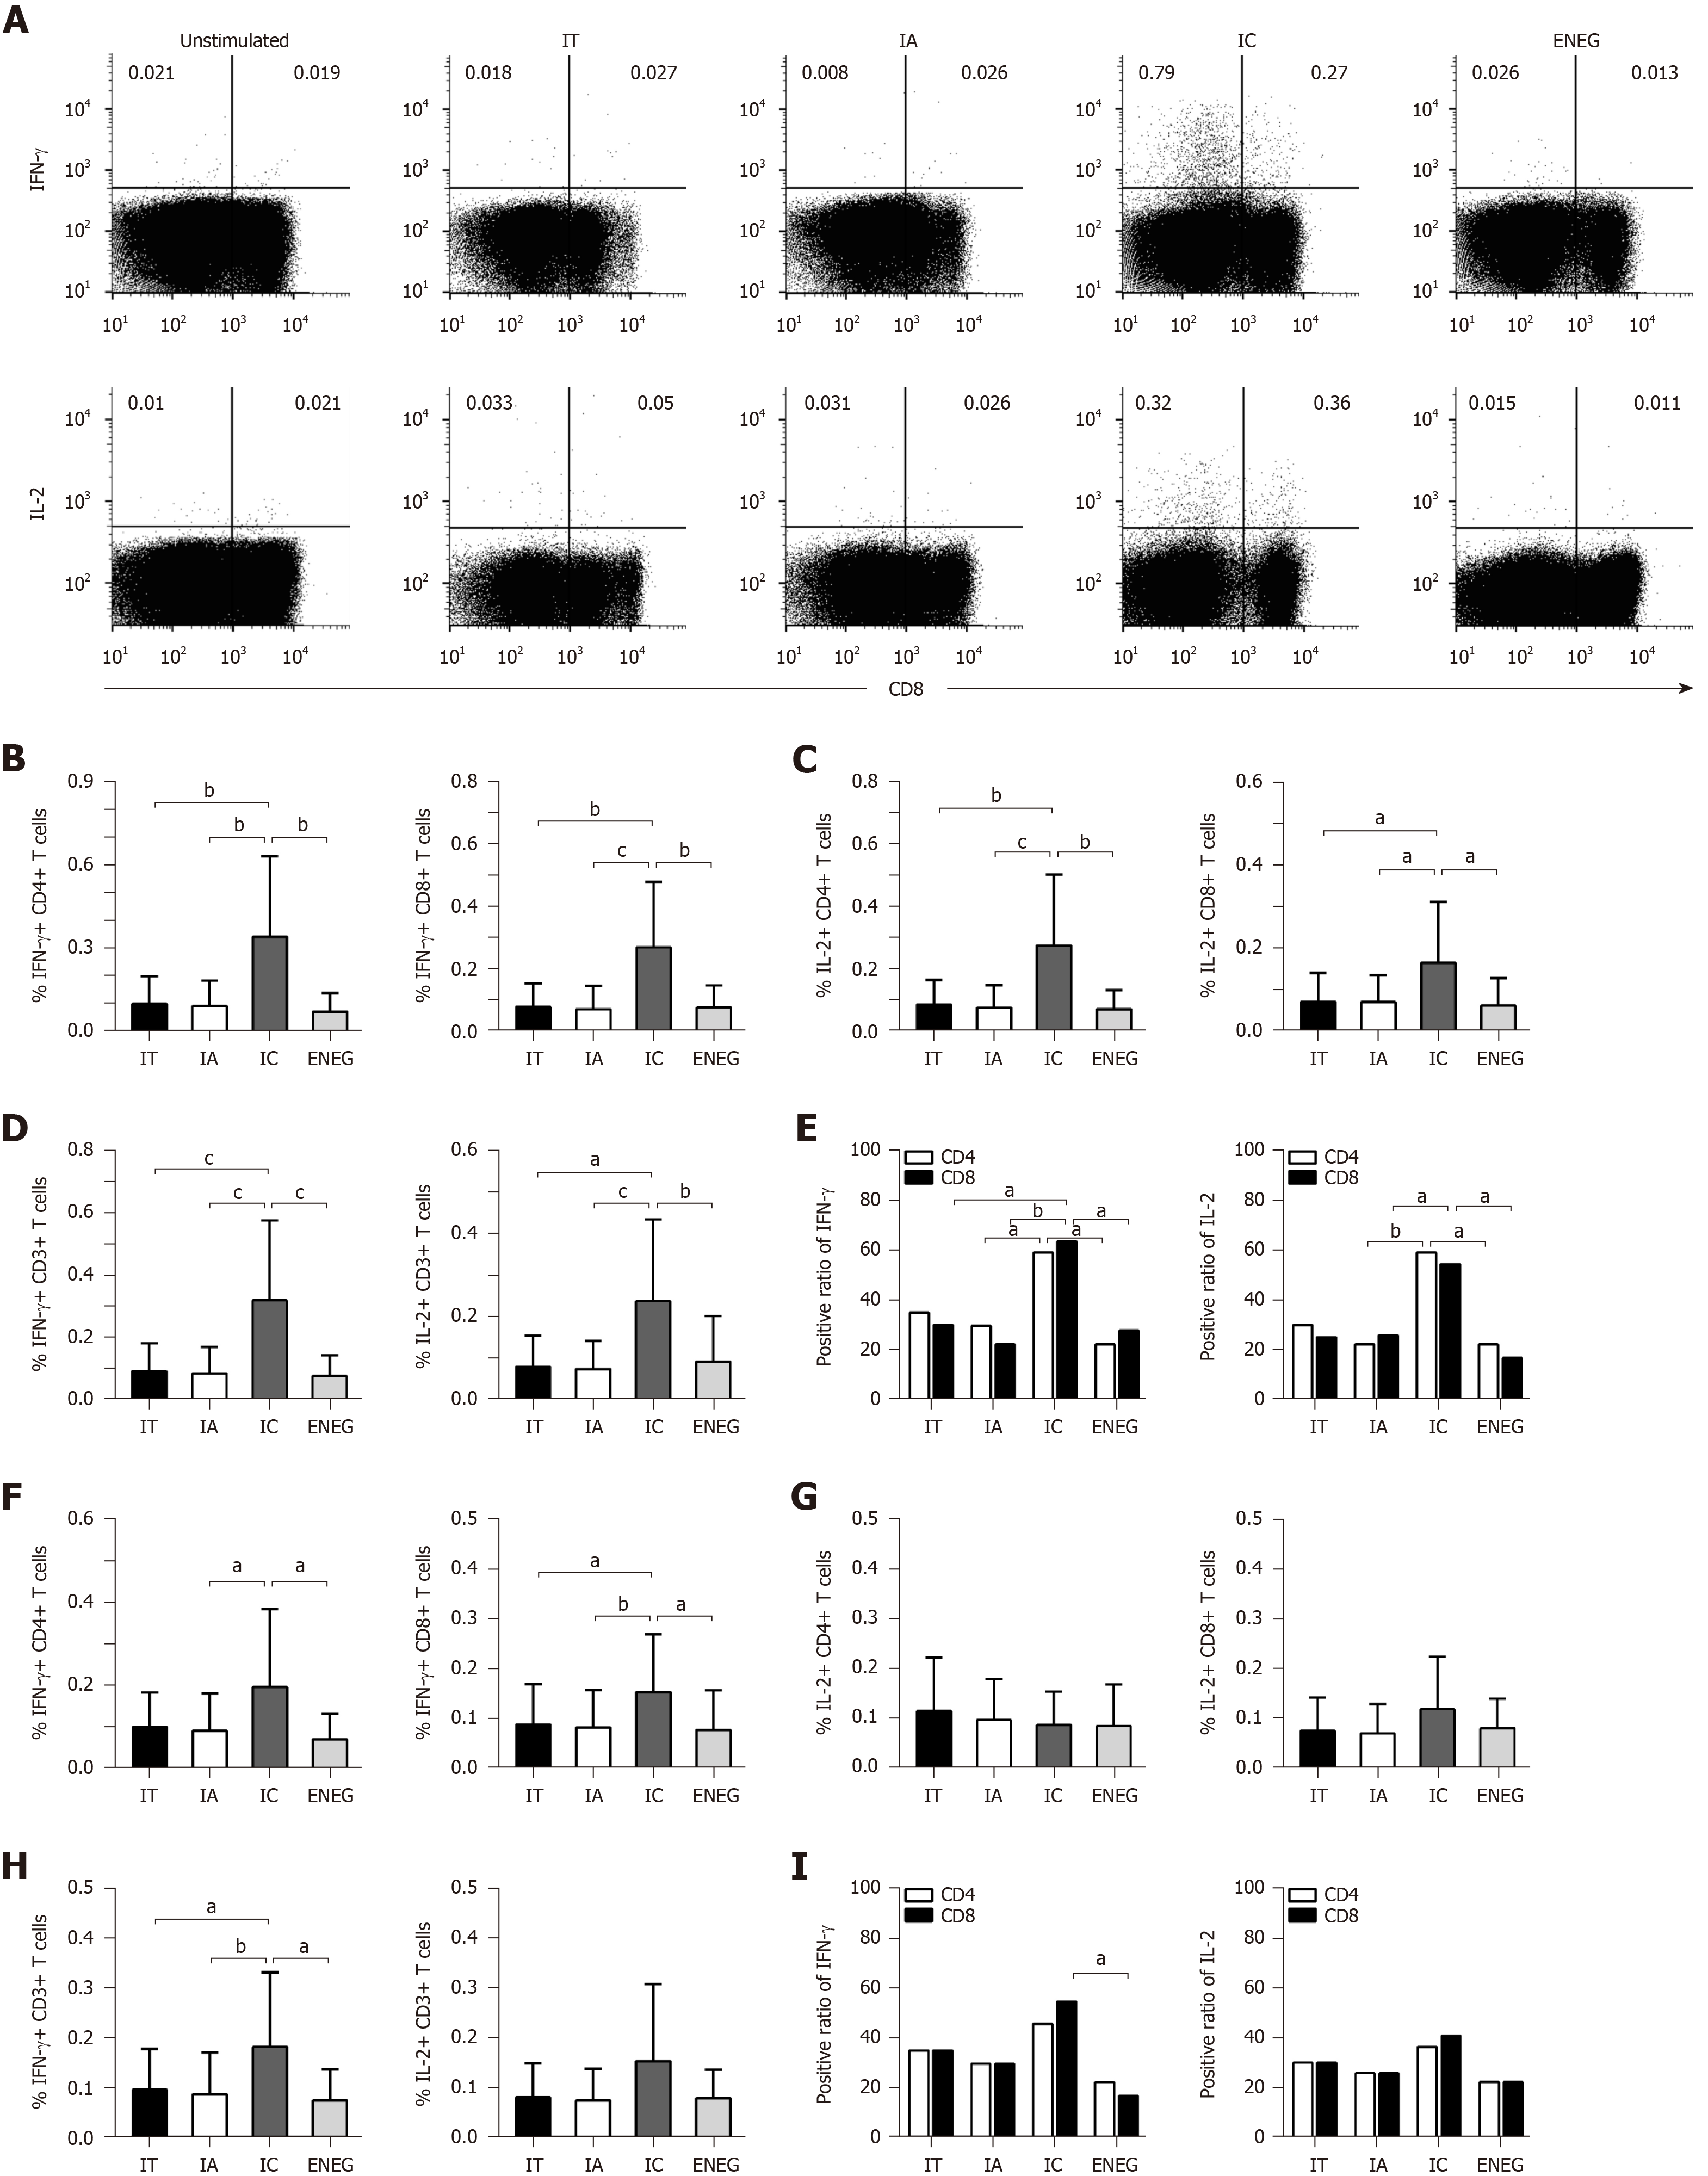
Figure 5 Virus-specific T cell responses after in vitro expansion in different clinical phases.
Peripheral blood mononuclear cells were incubated with core or S peptide pools. After 10 d in vitro culture, virus-specific T cell responses were determined by detecting the frequency of T cells producing interferon-gamma (IFN-γ) and IL-2. A: Gated on CD3+ lymphocytes, representative dot plots depict the frequency of CD4+ (upper-left quadrant) and CD8+ (upper-right quadrant) T cells-producing IFN-γ or IL-2; B: IFN-γ production by CD4+ and CD8+ T cells in response to the core peptide pool; C: IL-2 production by CD4+ and CD8+ T cells in response to the core peptide pool; D: IFN-γ and IL-2 production by CD3+ T cells in response to the core peptide pool; E: Positive responses of CD4+ or CD8+ T cells producing IFN-γ or IL-2 in response to the core peptide pool; F: IFN-γ production by CD4+ and CD8+ T cells in response to the S peptide pool; G: IL-2 production by CD4+ and CD8+ T cells in response to the S peptide pool; H: IFN-γ and IL-2 production by CD3+ T cells in response to the S peptide pool; I: Positive responses of CD4+ or CD8+ T cells producing IFN-γ or IL-2 in response to the S peptide pool. IFN-γ: Interferon-gamma; TNF-α: Tumor necrosis factor-alpha; HD: Healthy donors; IT: Immune tolerant; IA: Immune active; IC: Inactive carrier; ENEG: Hepatitis B envelope antigen-negative hepatitis. All data are presented as mean ± SD, aP < 0.05, bP < 0.01, cP < 0.001.
- Citation: Wang WT, Zhao XQ, Li GP, Chen YZ, Wang L, Han MF, Li WN, Chen T, Chen G, Xu D, Ning Q, Zhao XP. Immune response pattern varies with the natural history of chronic hepatitis B. World J Gastroenterol 2019; 25(16): 1950-1963
- URL: https://www.wjgnet.com/1007-9327/full/v25/i16/1950.htm
- DOI: https://dx.doi.org/10.3748/wjg.v25.i16.1950


