Copyright
©The Author(s) 2019.
World J Gastroenterol. Apr 14, 2019; 25(14): 1715-1728
Published online Apr 14, 2019. doi: 10.3748/wjg.v25.i14.1715
Published online Apr 14, 2019. doi: 10.3748/wjg.v25.i14.1715
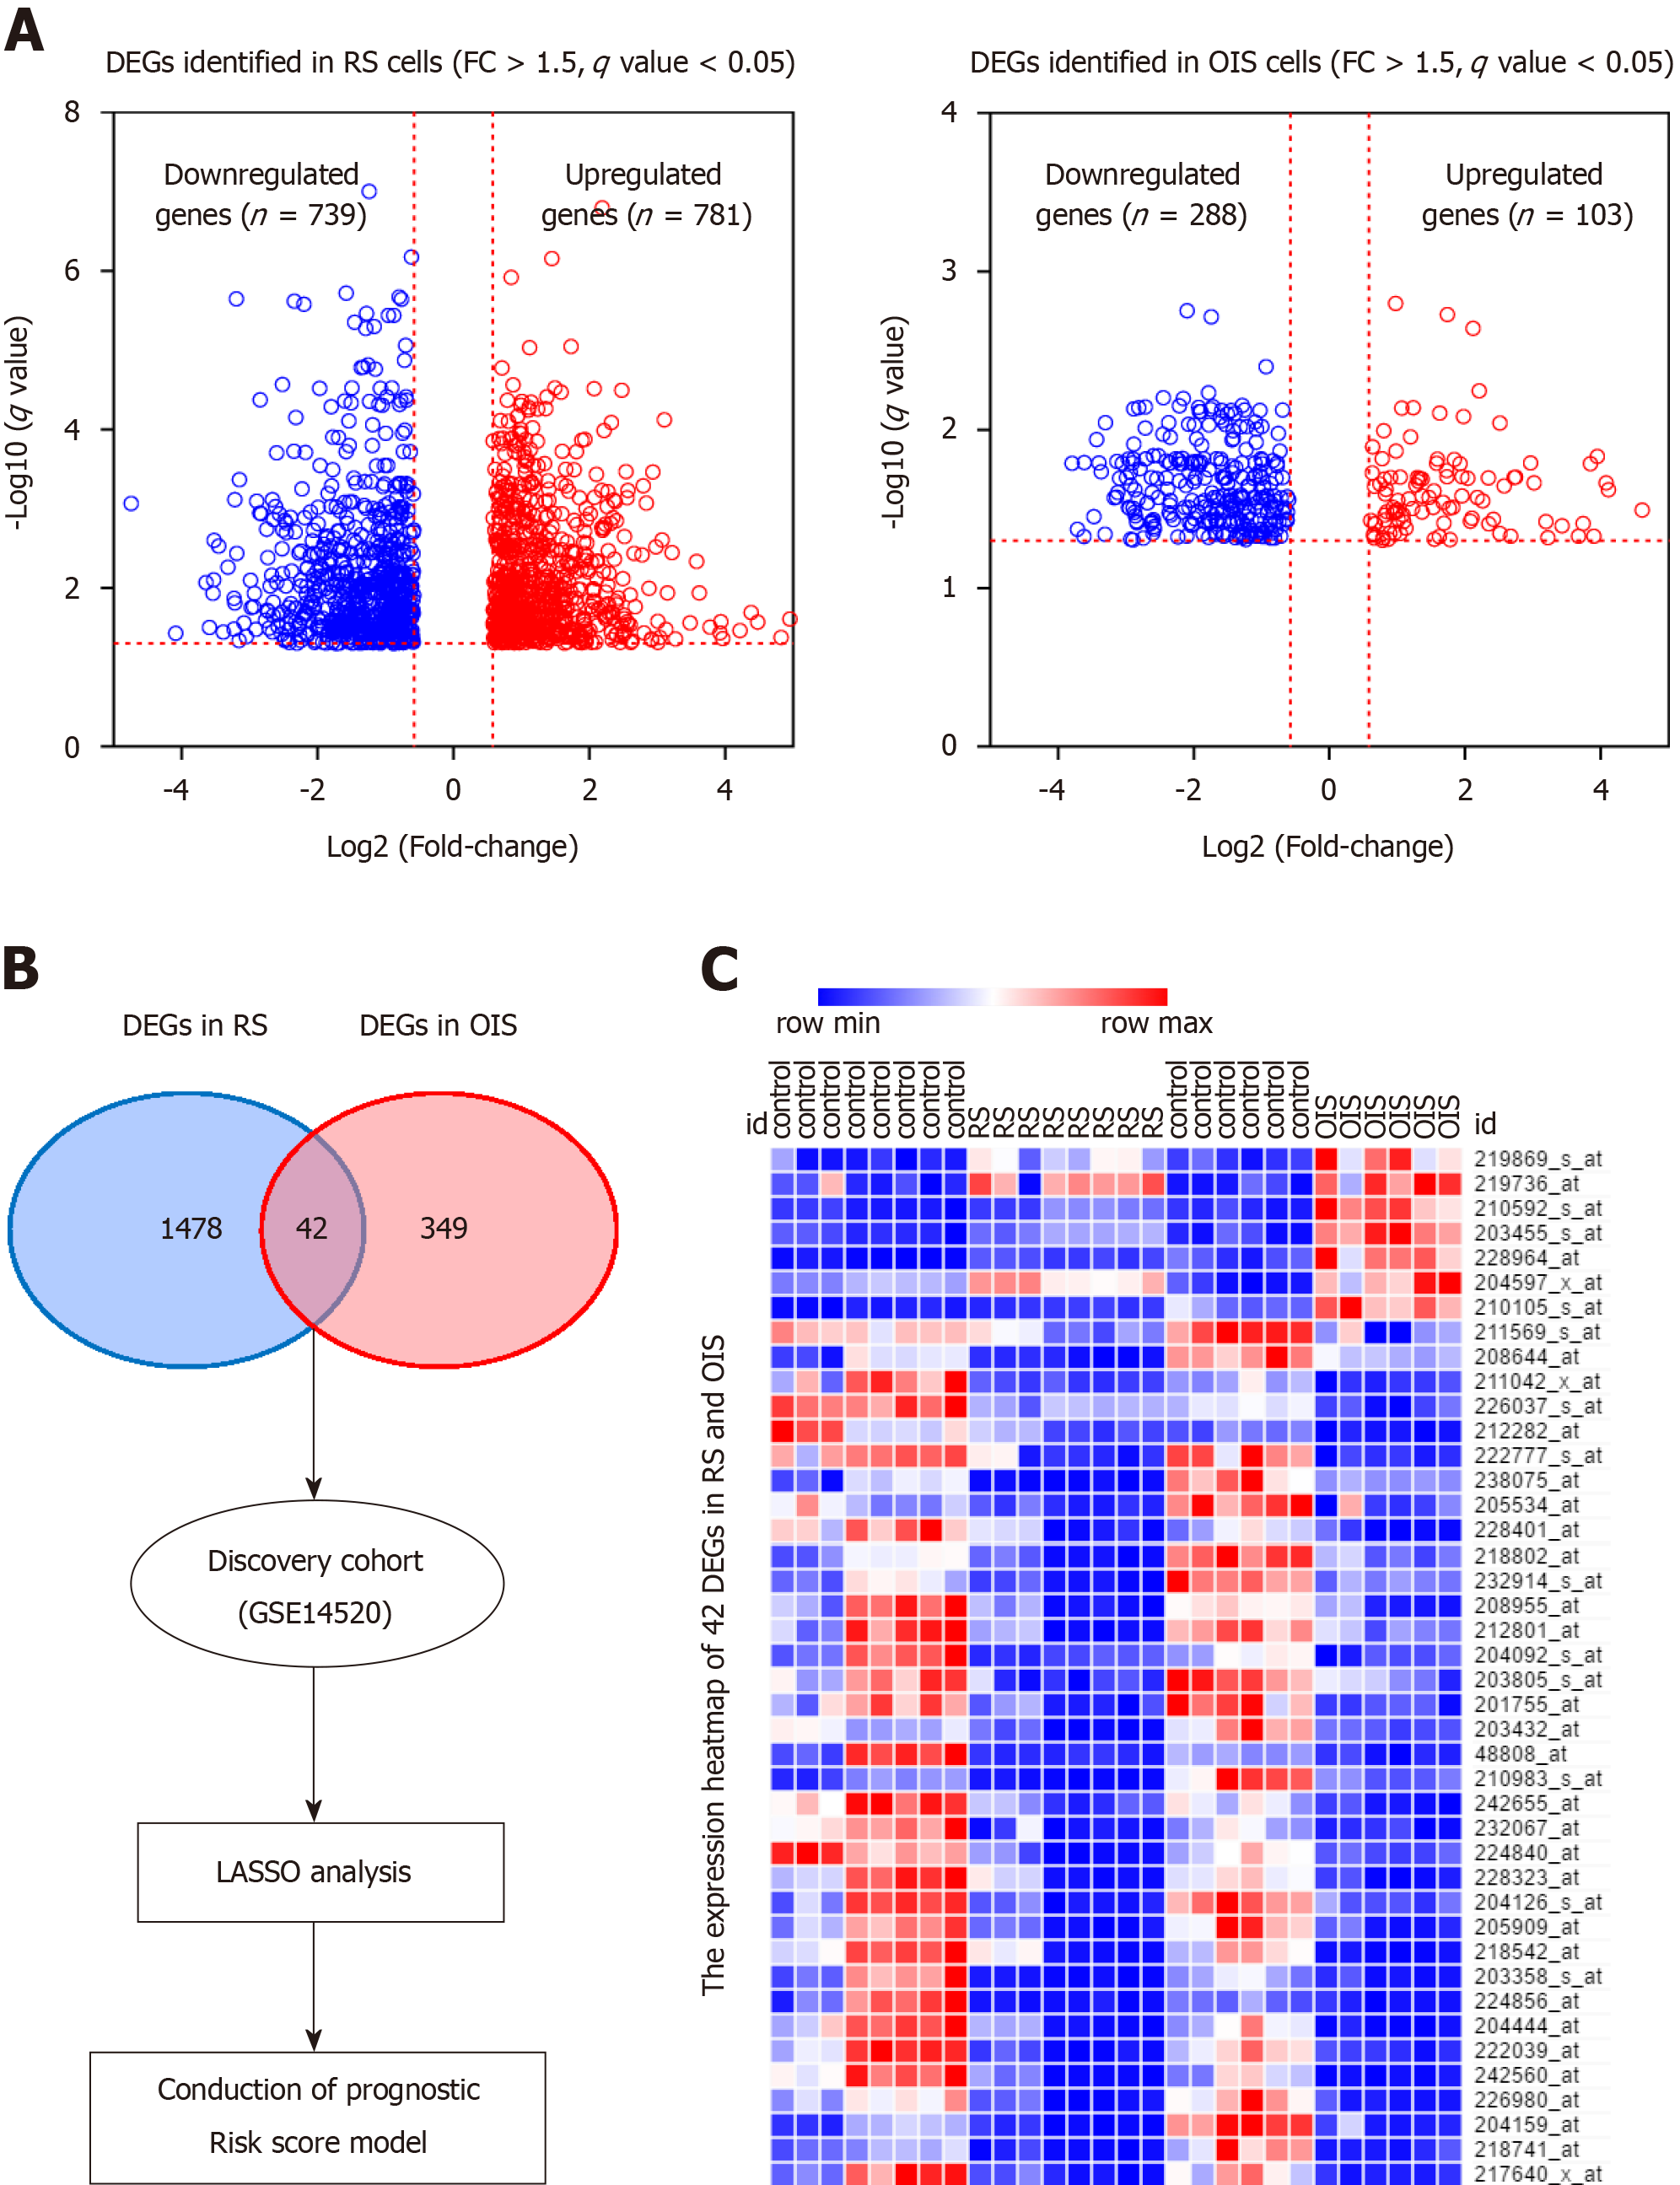
Figure 2 Expression of differentially expressed genes in senescent cells.
A: The differentially expressed genes were identified in replicative senescence (RS) and oncogene-induced senescence (OIS) models. There were 781 up-regulated and 739 down-regulated genes selected using the RS model, and 103 up-regulated and 288 down-regulated genes selected using the OIS model; B: Overlapping the two lists, 42 common differentially expressed genes were selected as senescence associated genes; C: The expression levels of 42 genes are presented as a heat map in RS and OIS models. DEGs: Differentially expressed genes; RS: Replicative senescence; OIS: Oncogene-induced senescence; SAGs: Senescence associated genes; FC: Fold change; LASSO: Least absolute shrinkage and selection operator.
- Citation: Xiang XH, Yang L, Zhang X, Ma XH, Miao RC, Gu JX, Fu YN, Yao Q, Zhang JY, Liu C, Lin T, Qu K. Seven-senescence-associated gene signature predicts overall survival for Asian patients with hepatocellular carcinoma. World J Gastroenterol 2019; 25(14): 1715-1728
- URL: https://www.wjgnet.com/1007-9327/full/v25/i14/1715.htm
- DOI: https://dx.doi.org/10.3748/wjg.v25.i14.1715


