Copyright
©The Author(s) 2019.
World J Gastroenterol. Mar 14, 2019; 25(10): 1266-1277
Published online Mar 14, 2019. doi: 10.3748/wjg.v25.i10.1266
Published online Mar 14, 2019. doi: 10.3748/wjg.v25.i10.1266
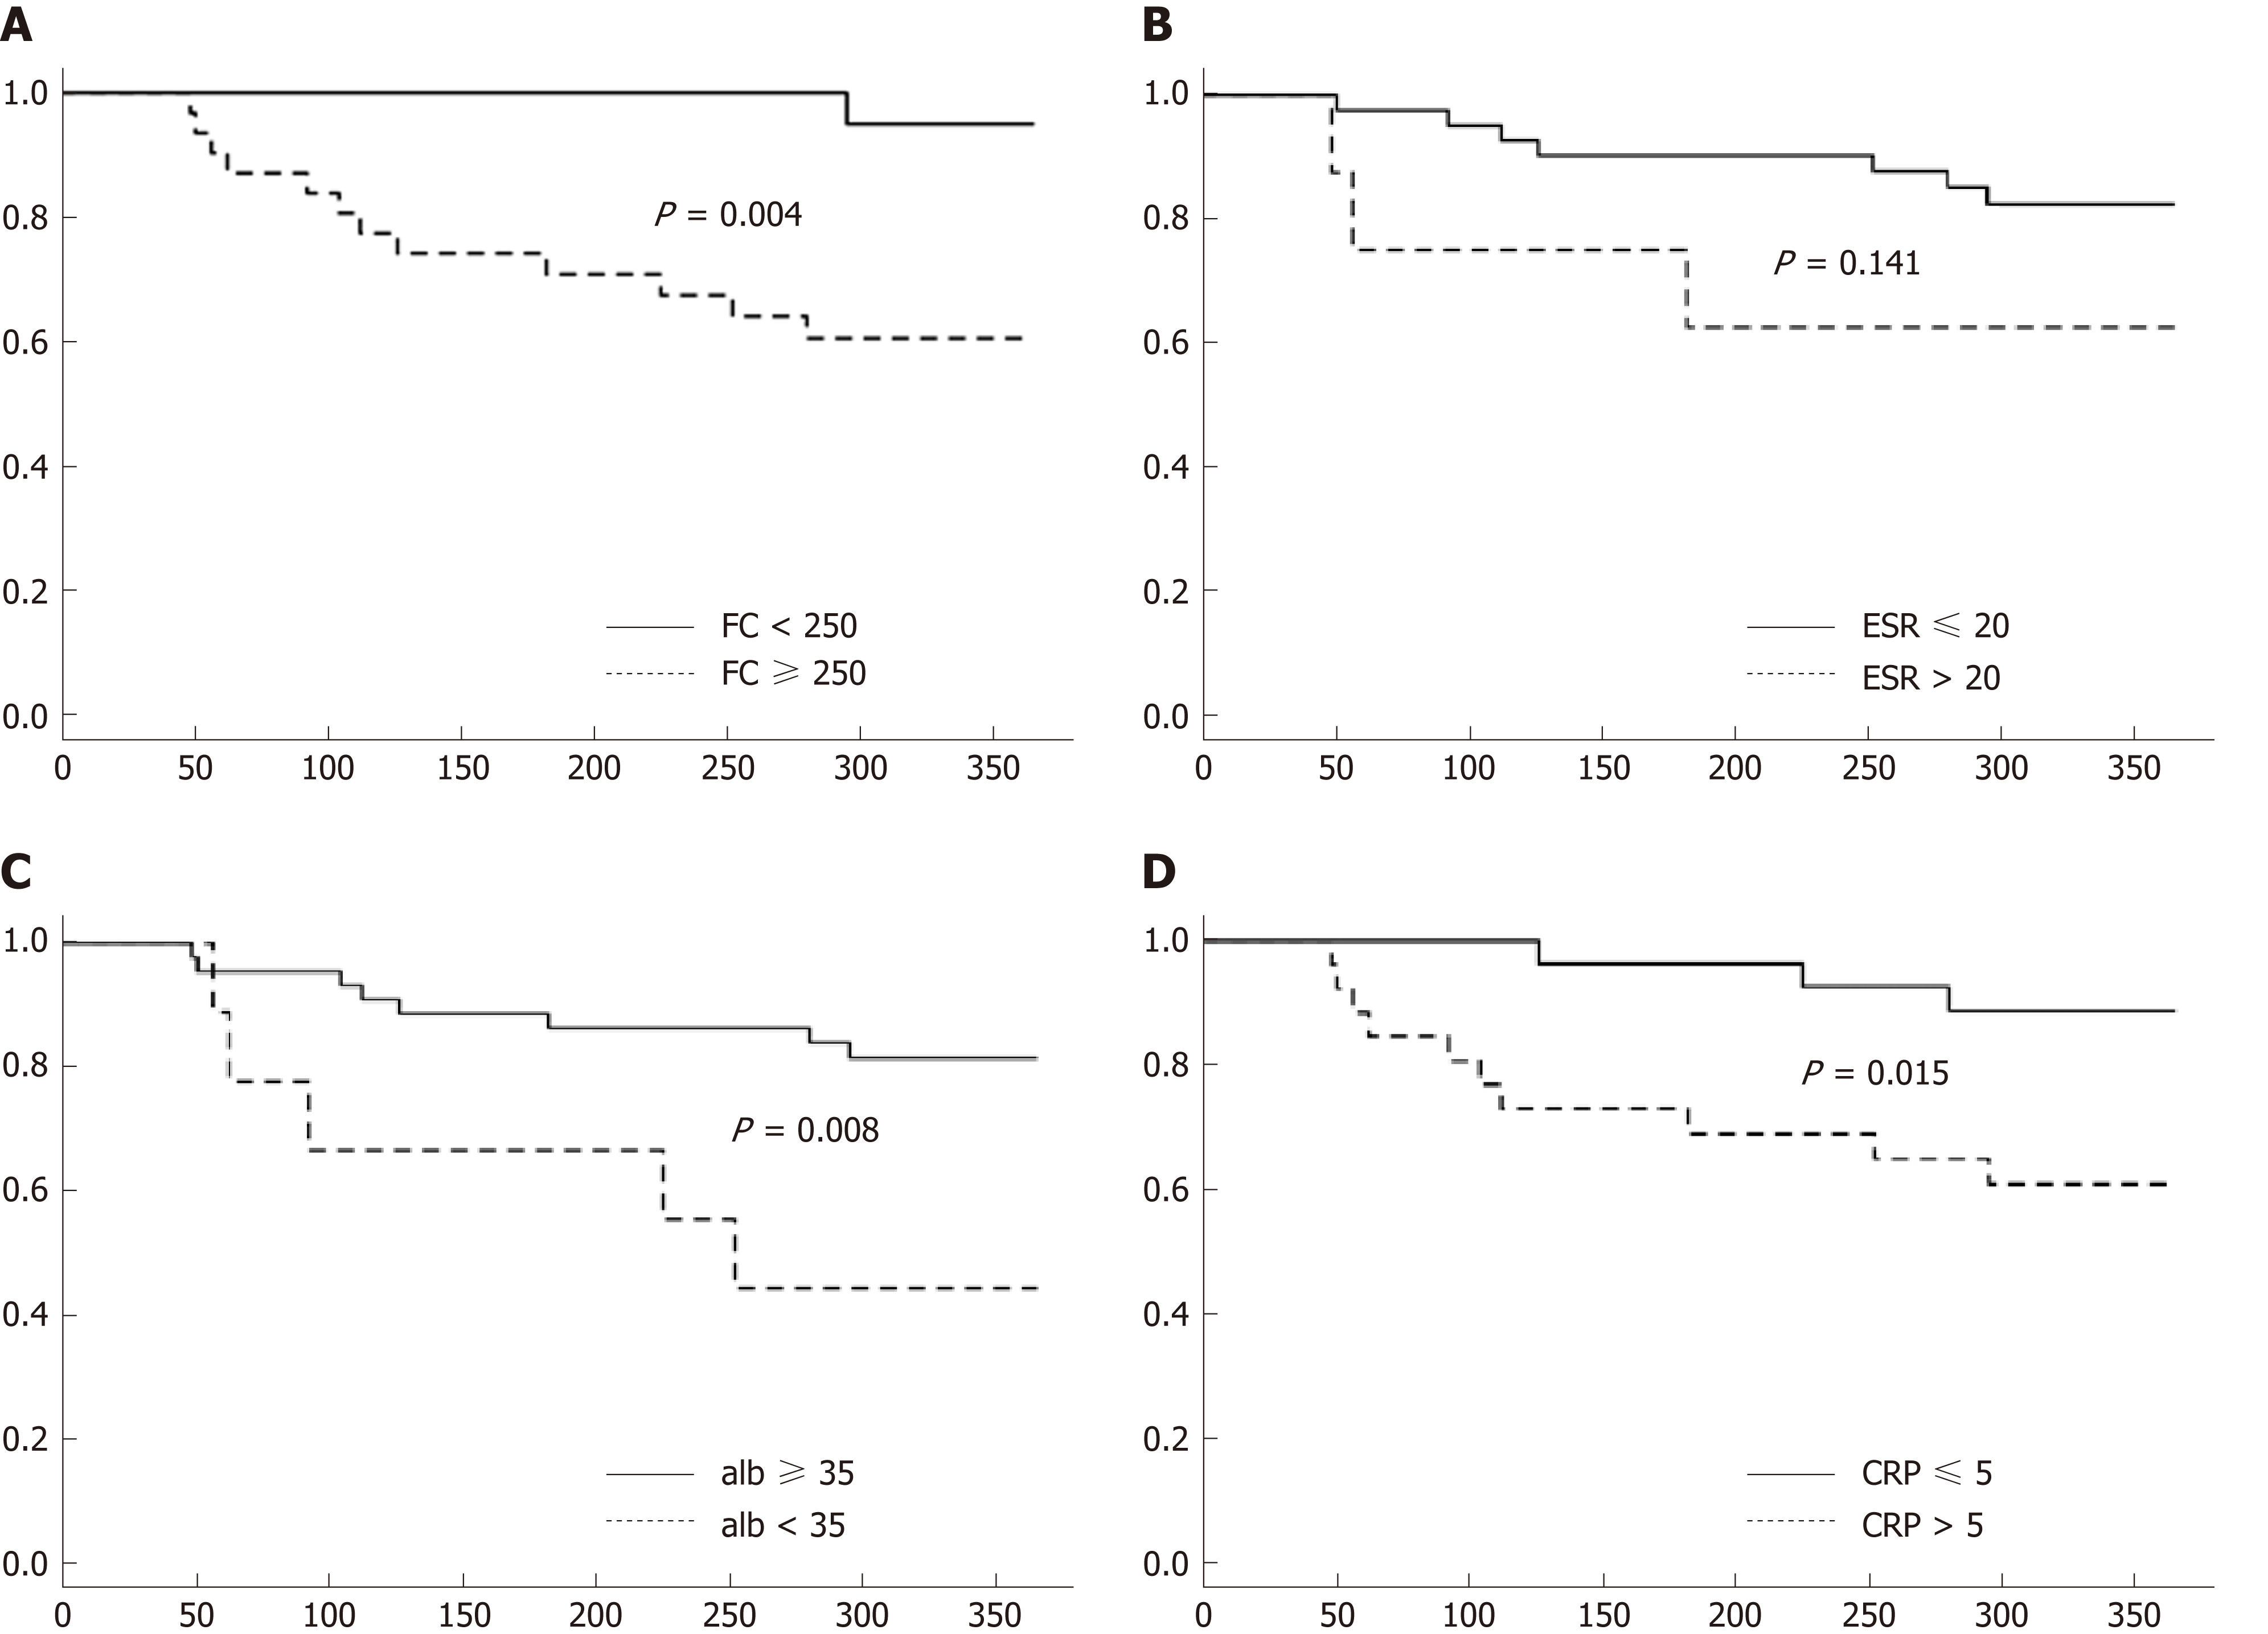
Figure 3 Kaplan-Meier curves at baseline through the first year of follow-up showing differences in predicting clinical relapse.
A: Kaplan-Meier curves for FC; B: Kaplan-Meier curves for ESR; C: Kaplan-Meier curves for CRP; D: Kaplan-Meier curves for albumin. FC: Fecal calprotectin; ESR: Erythrocyte sedimentation rate; CRP: C-reactive protein.
- Citation: Foster AJ, Smyth M, Lakhani A, Jung B, Brant RF, Jacobson K. Consecutive fecal calprotectin measurements for predicting relapse in pediatric Crohn’s disease patients. World J Gastroenterol 2019; 25(10): 1266-1277
- URL: https://www.wjgnet.com/1007-9327/full/v25/i10/1266.htm
- DOI: https://dx.doi.org/10.3748/wjg.v25.i10.1266


