Copyright
©The Author(s) 2019.
World J Gastroenterol. Mar 14, 2019; 25(10): 1248-1258
Published online Mar 14, 2019. doi: 10.3748/wjg.v25.i10.1248
Published online Mar 14, 2019. doi: 10.3748/wjg.v25.i10.1248
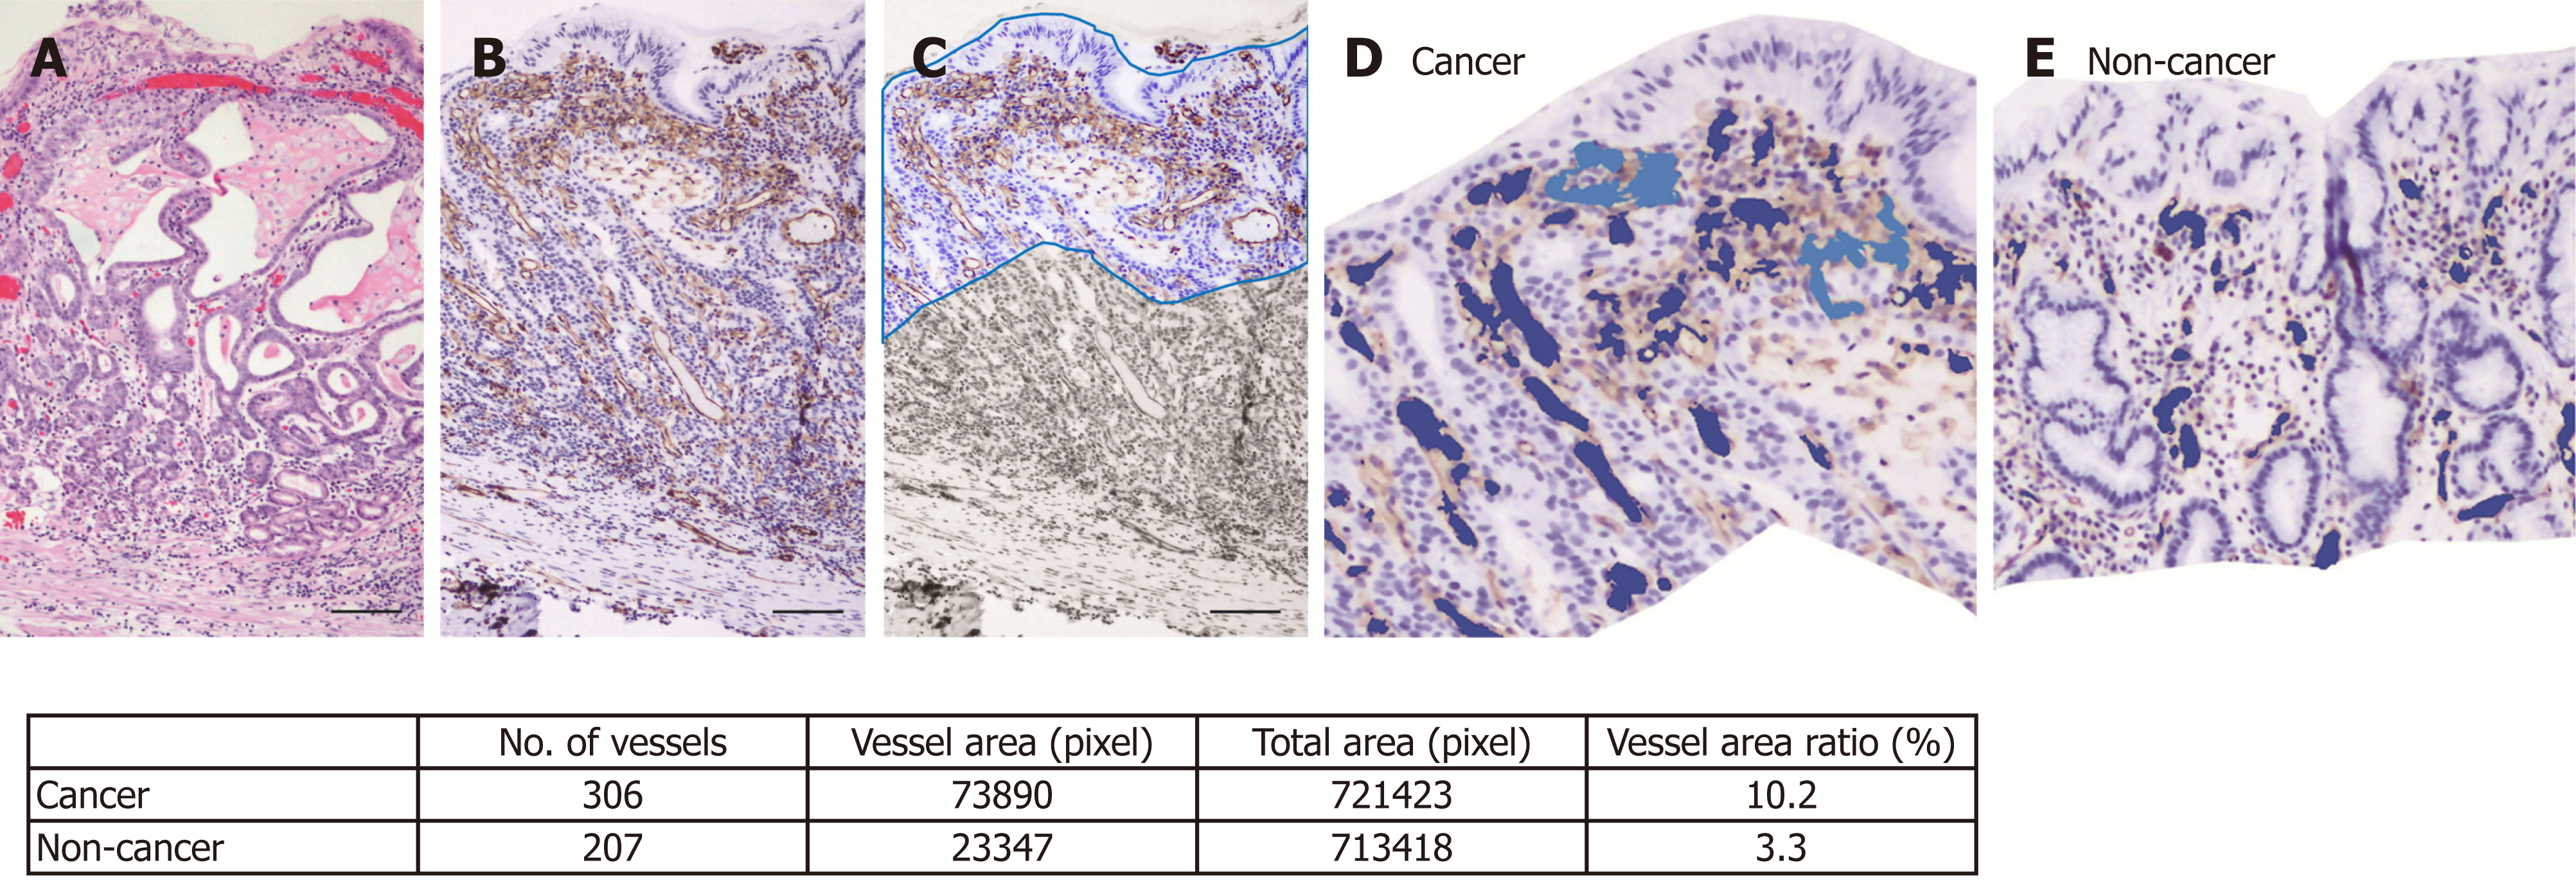
Figure 2 An example of blood vessel density calculation by imaging analysis software.
A: Hematoxylin and eosin staining of a cancer lesion (case 43, original magnification × 100, scale bar 100 μm). B: CD31 immunohistochemistry highlights blood vessels. C: A depth of 350 μm was trimmed manually. Automatically recognized blood vessels are colored in the cancer lesion (D) and non-cancer area (E). The calculated blood vessel area and ratio in this case are shown in the table.
- Citation: Fujiyoshi T, Miyahara R, Funasaka K, Furukawa K, Sawada T, Maeda K, Yamamura T, Ishikawa T, Ohno E, Nakamura M, Kawashima H, Nakaguro M, Nakatochi M, Hirooka Y. Utility of linked color imaging for endoscopic diagnosis of early gastric cancer. World J Gastroenterol 2019; 25(10): 1248-1258
- URL: https://www.wjgnet.com/1007-9327/full/v25/i10/1248.htm
- DOI: https://dx.doi.org/10.3748/wjg.v25.i10.1248


