Copyright
©The Author(s) 2018.
World J Gastroenterol. Mar 7, 2018; 24(9): 957-970
Published online Mar 7, 2018. doi: 10.3748/wjg.v24.i9.957
Published online Mar 7, 2018. doi: 10.3748/wjg.v24.i9.957
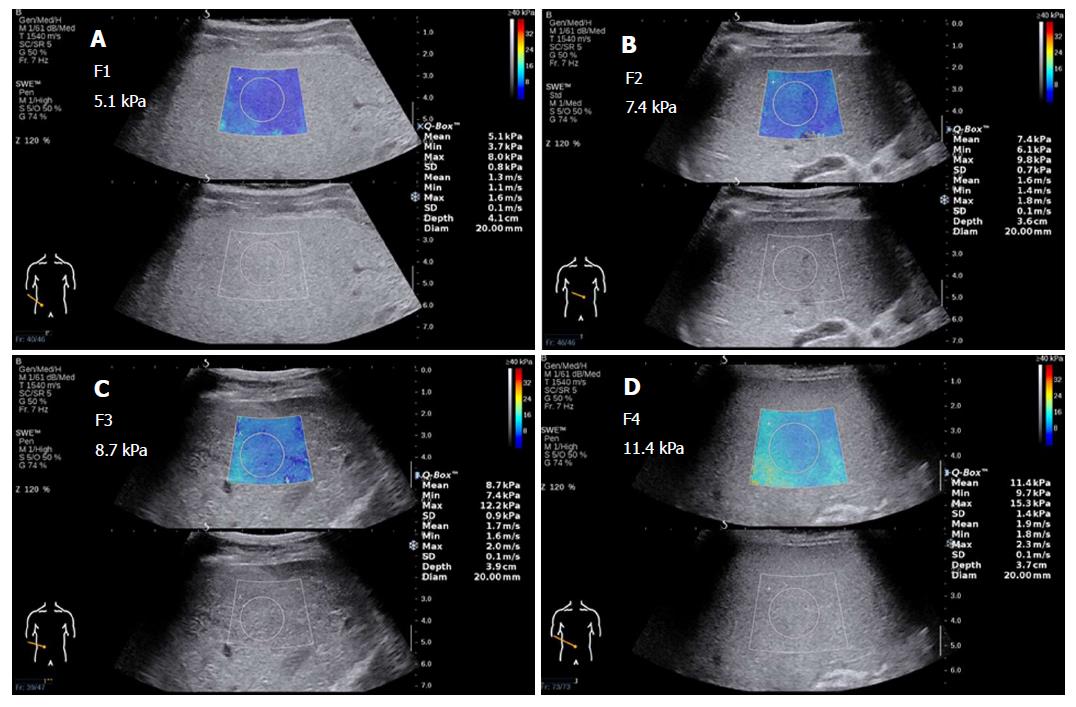
Figure 3 Two-dimensional shear wave elastography (Aixplorer US system, SuperSonic Imaging, France) of the liver in chronic hepatitis B patients with liver biopsy-proven fibrosis at METAVIR stages F1 through F4.
A: F1 stage, mean Young’s modulus = 5.1 kPa, mean shear wave velocity = 1.3 m/s; B: F2 stage, mean Young’s modulus = 7.4 kPa, mean shear wave velocity = 1.4 m/s; C: F3 stage, mean Young’s modulus = 8.7 kPa, mean shear wave velocity = 1.7 m/s; D: F4 stage, mean Young’s modulus = 11.4 kPa, mean shear wave velocity = 1.9 m/s. Note the liver stiffness gradually increases, and the color of the sampling frame gradually changes in the initial stages and incrementally increases in the later stages of fibrosis. 2D-SWE: Two-dimensional shear wave elastography; US: Ultrasound.
- Citation: Xie LT, Yan CH, Zhao QY, He MN, Jiang TA. Quantitative and noninvasive assessment of chronic liver diseases using two-dimensional shear wave elastography. World J Gastroenterol 2018; 24(9): 957-970
- URL: https://www.wjgnet.com/1007-9327/full/v24/i9/957.htm
- DOI: https://dx.doi.org/10.3748/wjg.v24.i9.957


