Copyright
©The Author(s) 2018.
World J Gastroenterol. Mar 7, 2018; 24(9): 957-970
Published online Mar 7, 2018. doi: 10.3748/wjg.v24.i9.957
Published online Mar 7, 2018. doi: 10.3748/wjg.v24.i9.957
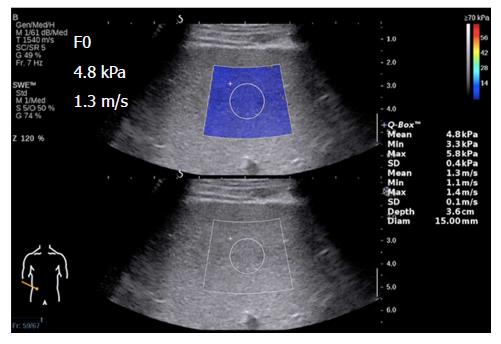
Figure 2 Example of two-dimensional shear wave elastography of the liver implemented using the Aixplorer US system (SuperSonic Imaging, France), which can be displayed simultaneously with the B-mode image.
A 2D-SWE image from a 42-year-old male who had normal liver function with liver biopsy-proven fibrosis at METAVIR stage F0. The rectangular box is the area of view where the shear wave measurements were made and color-coded. The round circle is the ROI where the measurements were obtained. The system provides the mean, Max, Min, SD and Diam of the stiffness measurements within the ROI. For this case, the following measurements were made: Young’s modulus: Mean = 4.8 kPa, Min = 3.3 kPa, Max = 5.8 kPa, SD = 0.4 kPa; shear wave velocity: Mean = 1.3 m/s, Min = 1.1 m/s, Max = 5.8 m/s, SD = 0.1 m/s, Depth = 3.6 cm, and Diam = 15.0 mm. 2D-SWE: Two-dimensional shear wave elastography; Diam: Diameter; Max: Maximum; Min: Minimum; ROI: Region of interest; SD: Standard deviation; US: Ultrasound.
- Citation: Xie LT, Yan CH, Zhao QY, He MN, Jiang TA. Quantitative and noninvasive assessment of chronic liver diseases using two-dimensional shear wave elastography. World J Gastroenterol 2018; 24(9): 957-970
- URL: https://www.wjgnet.com/1007-9327/full/v24/i9/957.htm
- DOI: https://dx.doi.org/10.3748/wjg.v24.i9.957


