Copyright
©The Author(s) 2018.
World J Gastroenterol. Feb 28, 2018; 24(8): 894-904
Published online Feb 28, 2018. doi: 10.3748/wjg.v24.i8.894
Published online Feb 28, 2018. doi: 10.3748/wjg.v24.i8.894
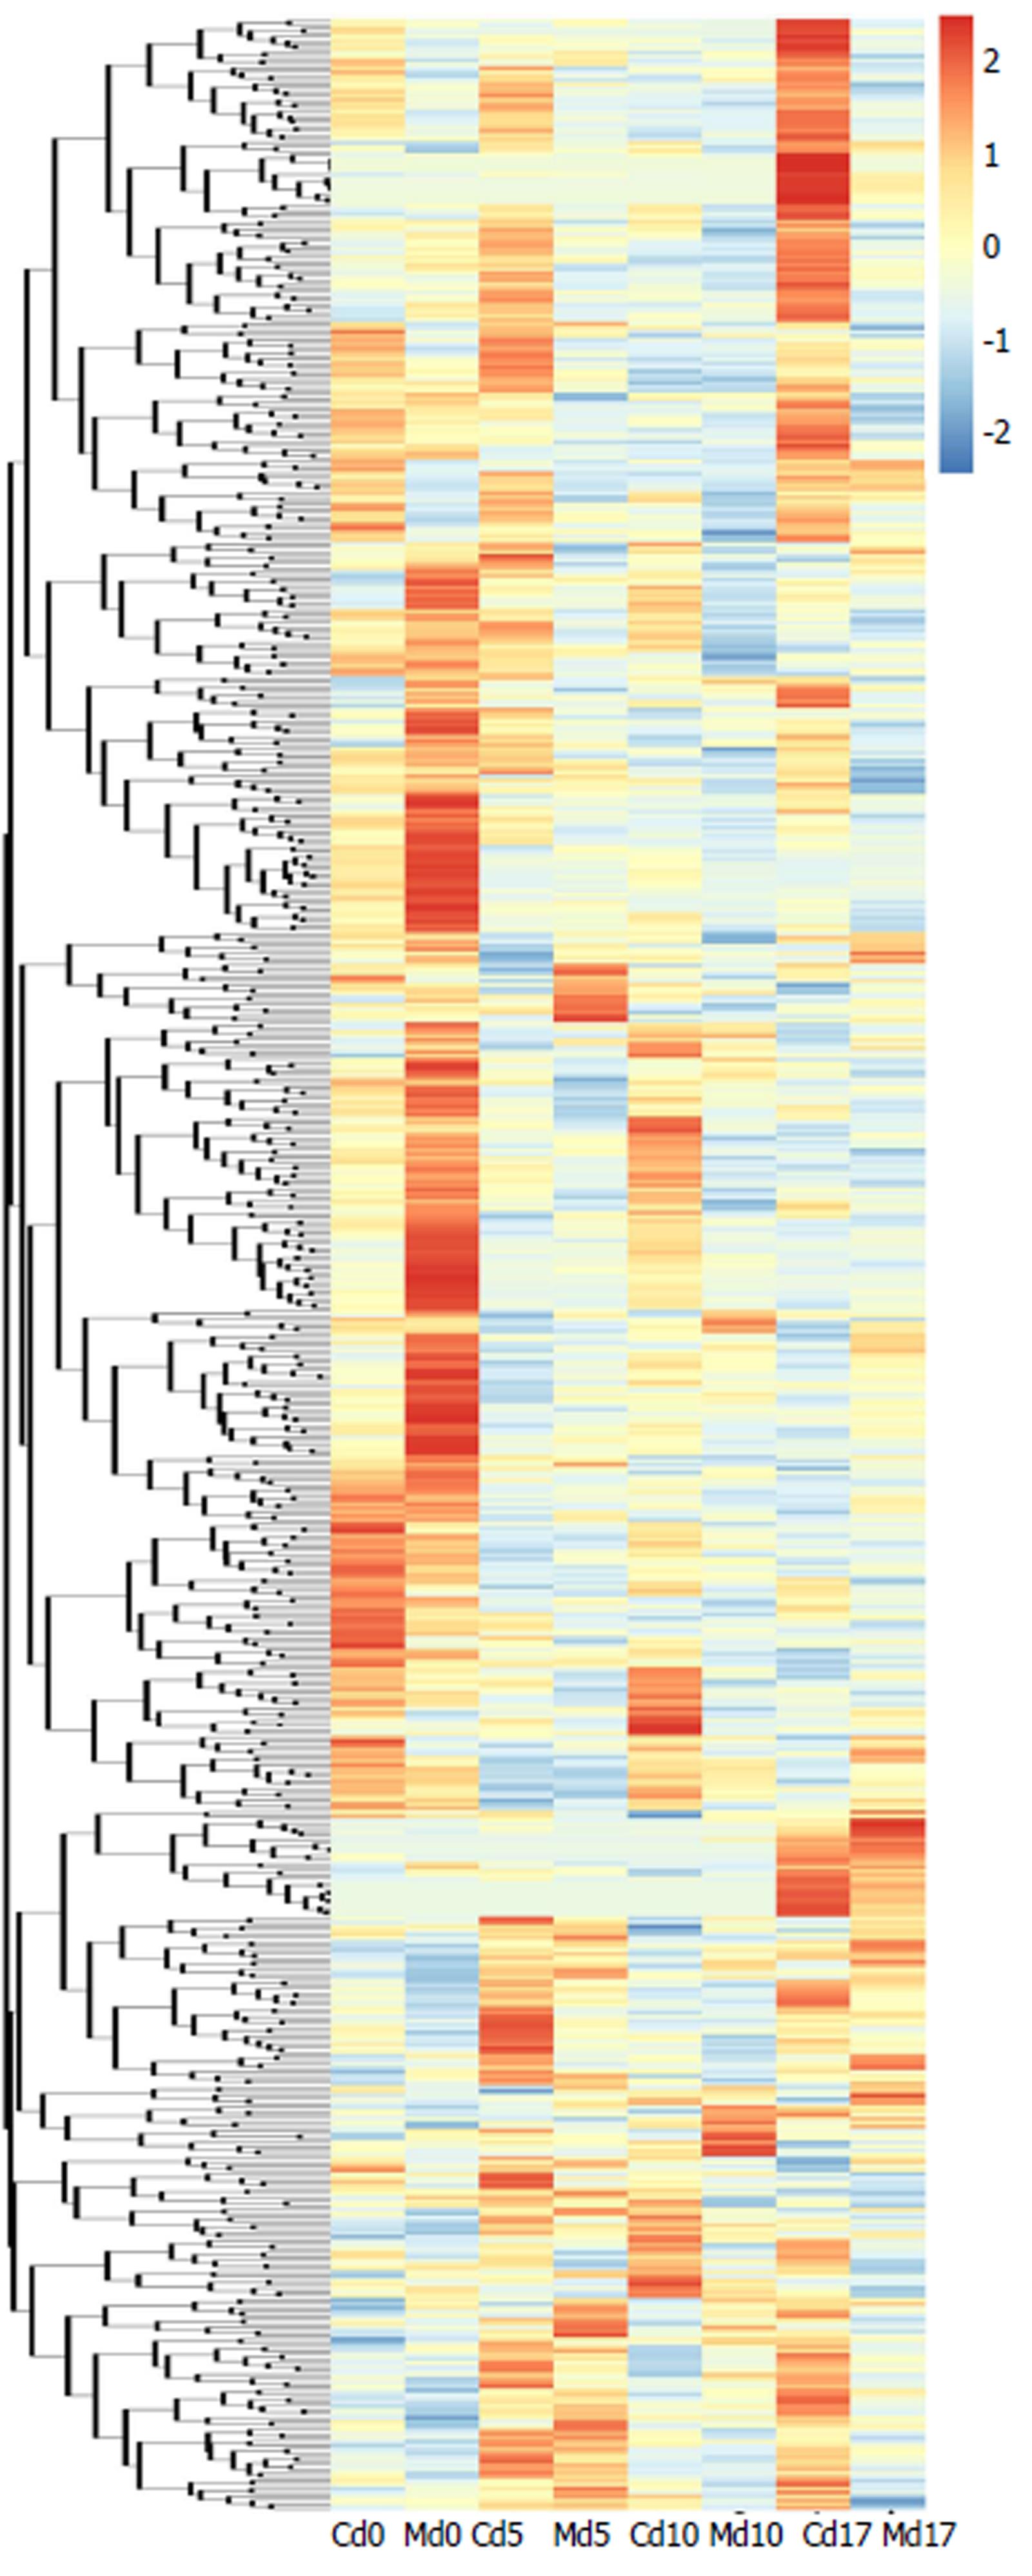
Figure 2 Heatmap of hierarchical clustering analysis for irritable bowel syndrome group vs control group at various time points.
The colors at different positions indicate the relative expression of the corresponding metabolites. C: Control group; M: Model (IBS) group. IBS: Irritable bowel syndrome.
- Citation: Yu LM, Zhao KJ, Wang SS, Wang X, Lu B. Gas chromatography/mass spectrometry based metabolomic study in a murine model of irritable bowel syndrome. World J Gastroenterol 2018; 24(8): 894-904
- URL: https://www.wjgnet.com/1007-9327/full/v24/i8/894.htm
- DOI: https://dx.doi.org/10.3748/wjg.v24.i8.894


