Copyright
©The Author(s) 2018.
World J Gastroenterol. Feb 21, 2018; 24(7): 833-843
Published online Feb 21, 2018. doi: 10.3748/wjg.v24.i7.833
Published online Feb 21, 2018. doi: 10.3748/wjg.v24.i7.833
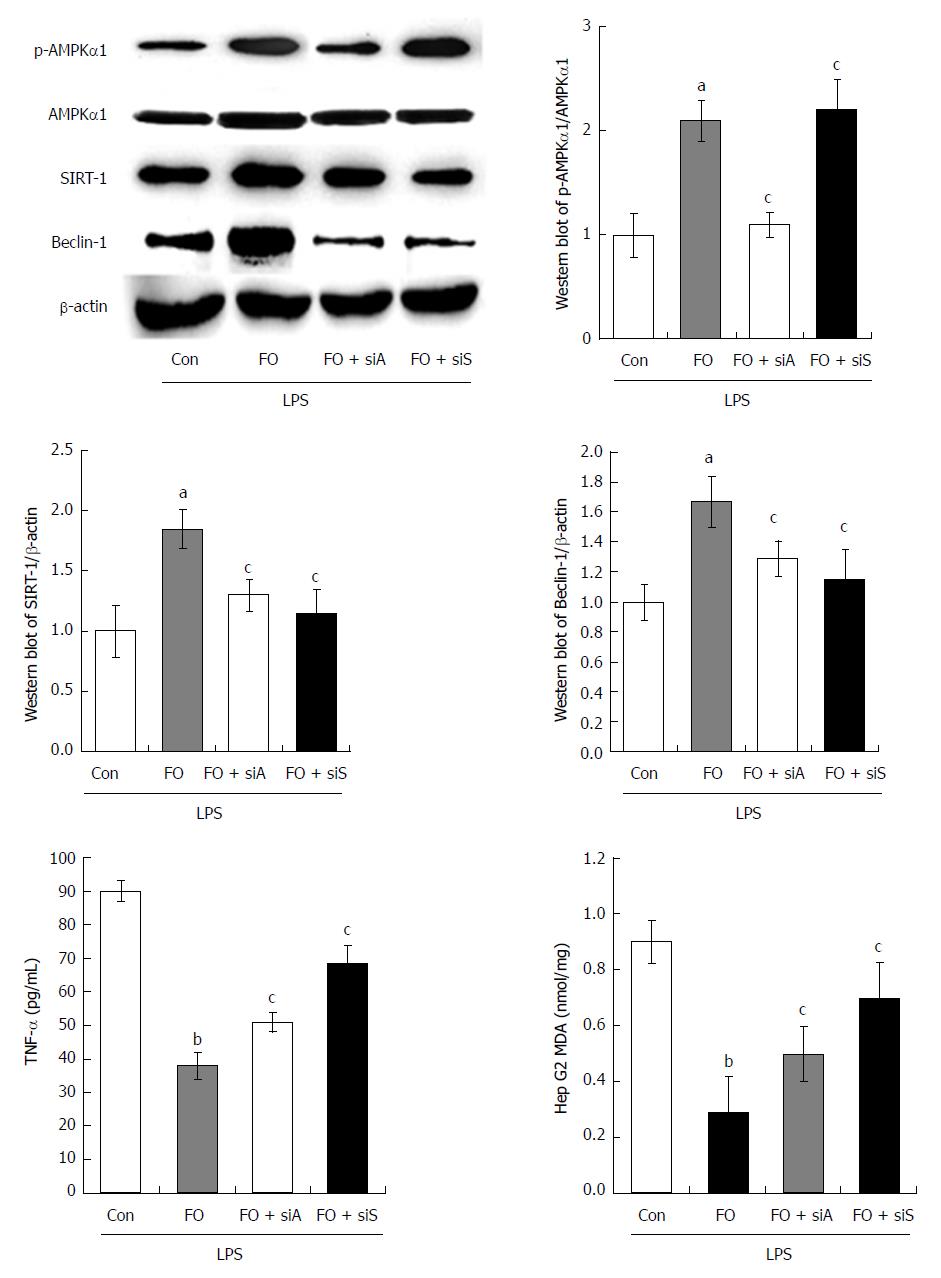
Figure 5 p-AMPK, AMPK, SIRT-1, Beclin-1, TNF-α, and MDA expression in HepG2 cells challenged with LPS, LPS + FO, LPS + FO + siAMPK, or LPS + FO + siSIRT-1 (mean ± SD, n = 3).
aP < 0.05, bP < 0.01 vs control; cP < 0.05 vs FO.
- Citation: Jing HR, Luo FW, Liu XM, Tian XF, Zhou Y. Fish oil alleviates liver injury induced by intestinal ischemia/reperfusion via AMPK/SIRT-1/autophagy pathway. World J Gastroenterol 2018; 24(7): 833-843
- URL: https://www.wjgnet.com/1007-9327/full/v24/i7/833.htm
- DOI: https://dx.doi.org/10.3748/wjg.v24.i7.833


