Copyright
©The Author(s) 2018.
World J Gastroenterol. Feb 21, 2018; 24(7): 775-793
Published online Feb 21, 2018. doi: 10.3748/wjg.v24.i7.775
Published online Feb 21, 2018. doi: 10.3748/wjg.v24.i7.775
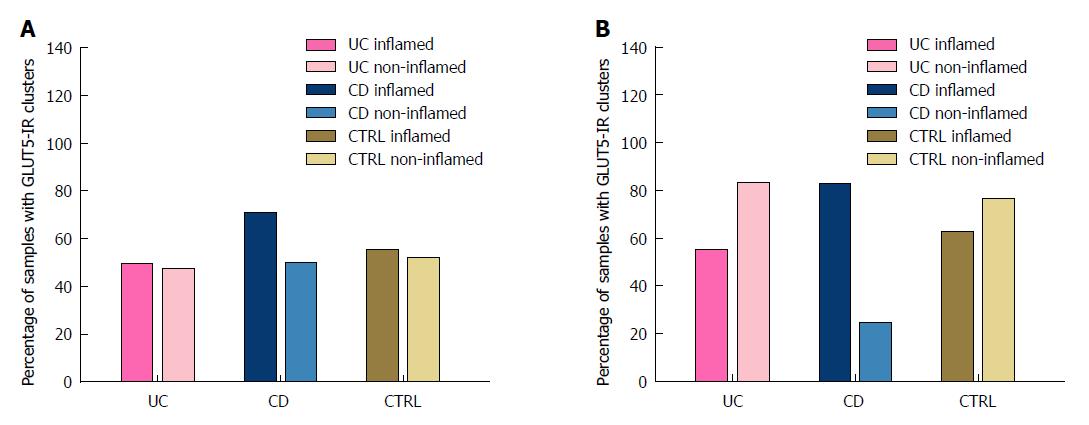
Figure 6 Bar graphs of the percentage of samples with GLUT5-immunoreactive clusters of lymphatic vessels in the proximal tract (Panel A) and distal tract (Panel B) of large intestine of patients with ulcerative colitis, Crohn’s disease, and controls.
Inflamed and non-inflamed mucosa can be distinguished for each patient group. In the UC and CTRL groups, the percentage is similar for inflamed and non-inflamed mucosa in the proximal tract, and higher for non-inflamed than inflamed mucosa in the distal tract. In the CD group, the percentage is higher for inflamed than non-inflamed mucosa in both the proximal and the distal tract. UC: Ulcerative colitis; CD: Crohn’s disease; CTRL: Controls.
- Citation: Merigo F, Brandolese A, Facchin S, Missaggia S, Bernardi P, Boschi F, D’Incà R, Savarino EV, Sbarbati A, Sturniolo GC. Glucose transporter expression in the human colon. World J Gastroenterol 2018; 24(7): 775-793
- URL: https://www.wjgnet.com/1007-9327/full/v24/i7/775.htm
- DOI: https://dx.doi.org/10.3748/wjg.v24.i7.775


