Copyright
©The Author(s) 2018.
World J Gastroenterol. Feb 14, 2018; 24(6): 725-736
Published online Feb 14, 2018. doi: 10.3748/wjg.v24.i6.725
Published online Feb 14, 2018. doi: 10.3748/wjg.v24.i6.725
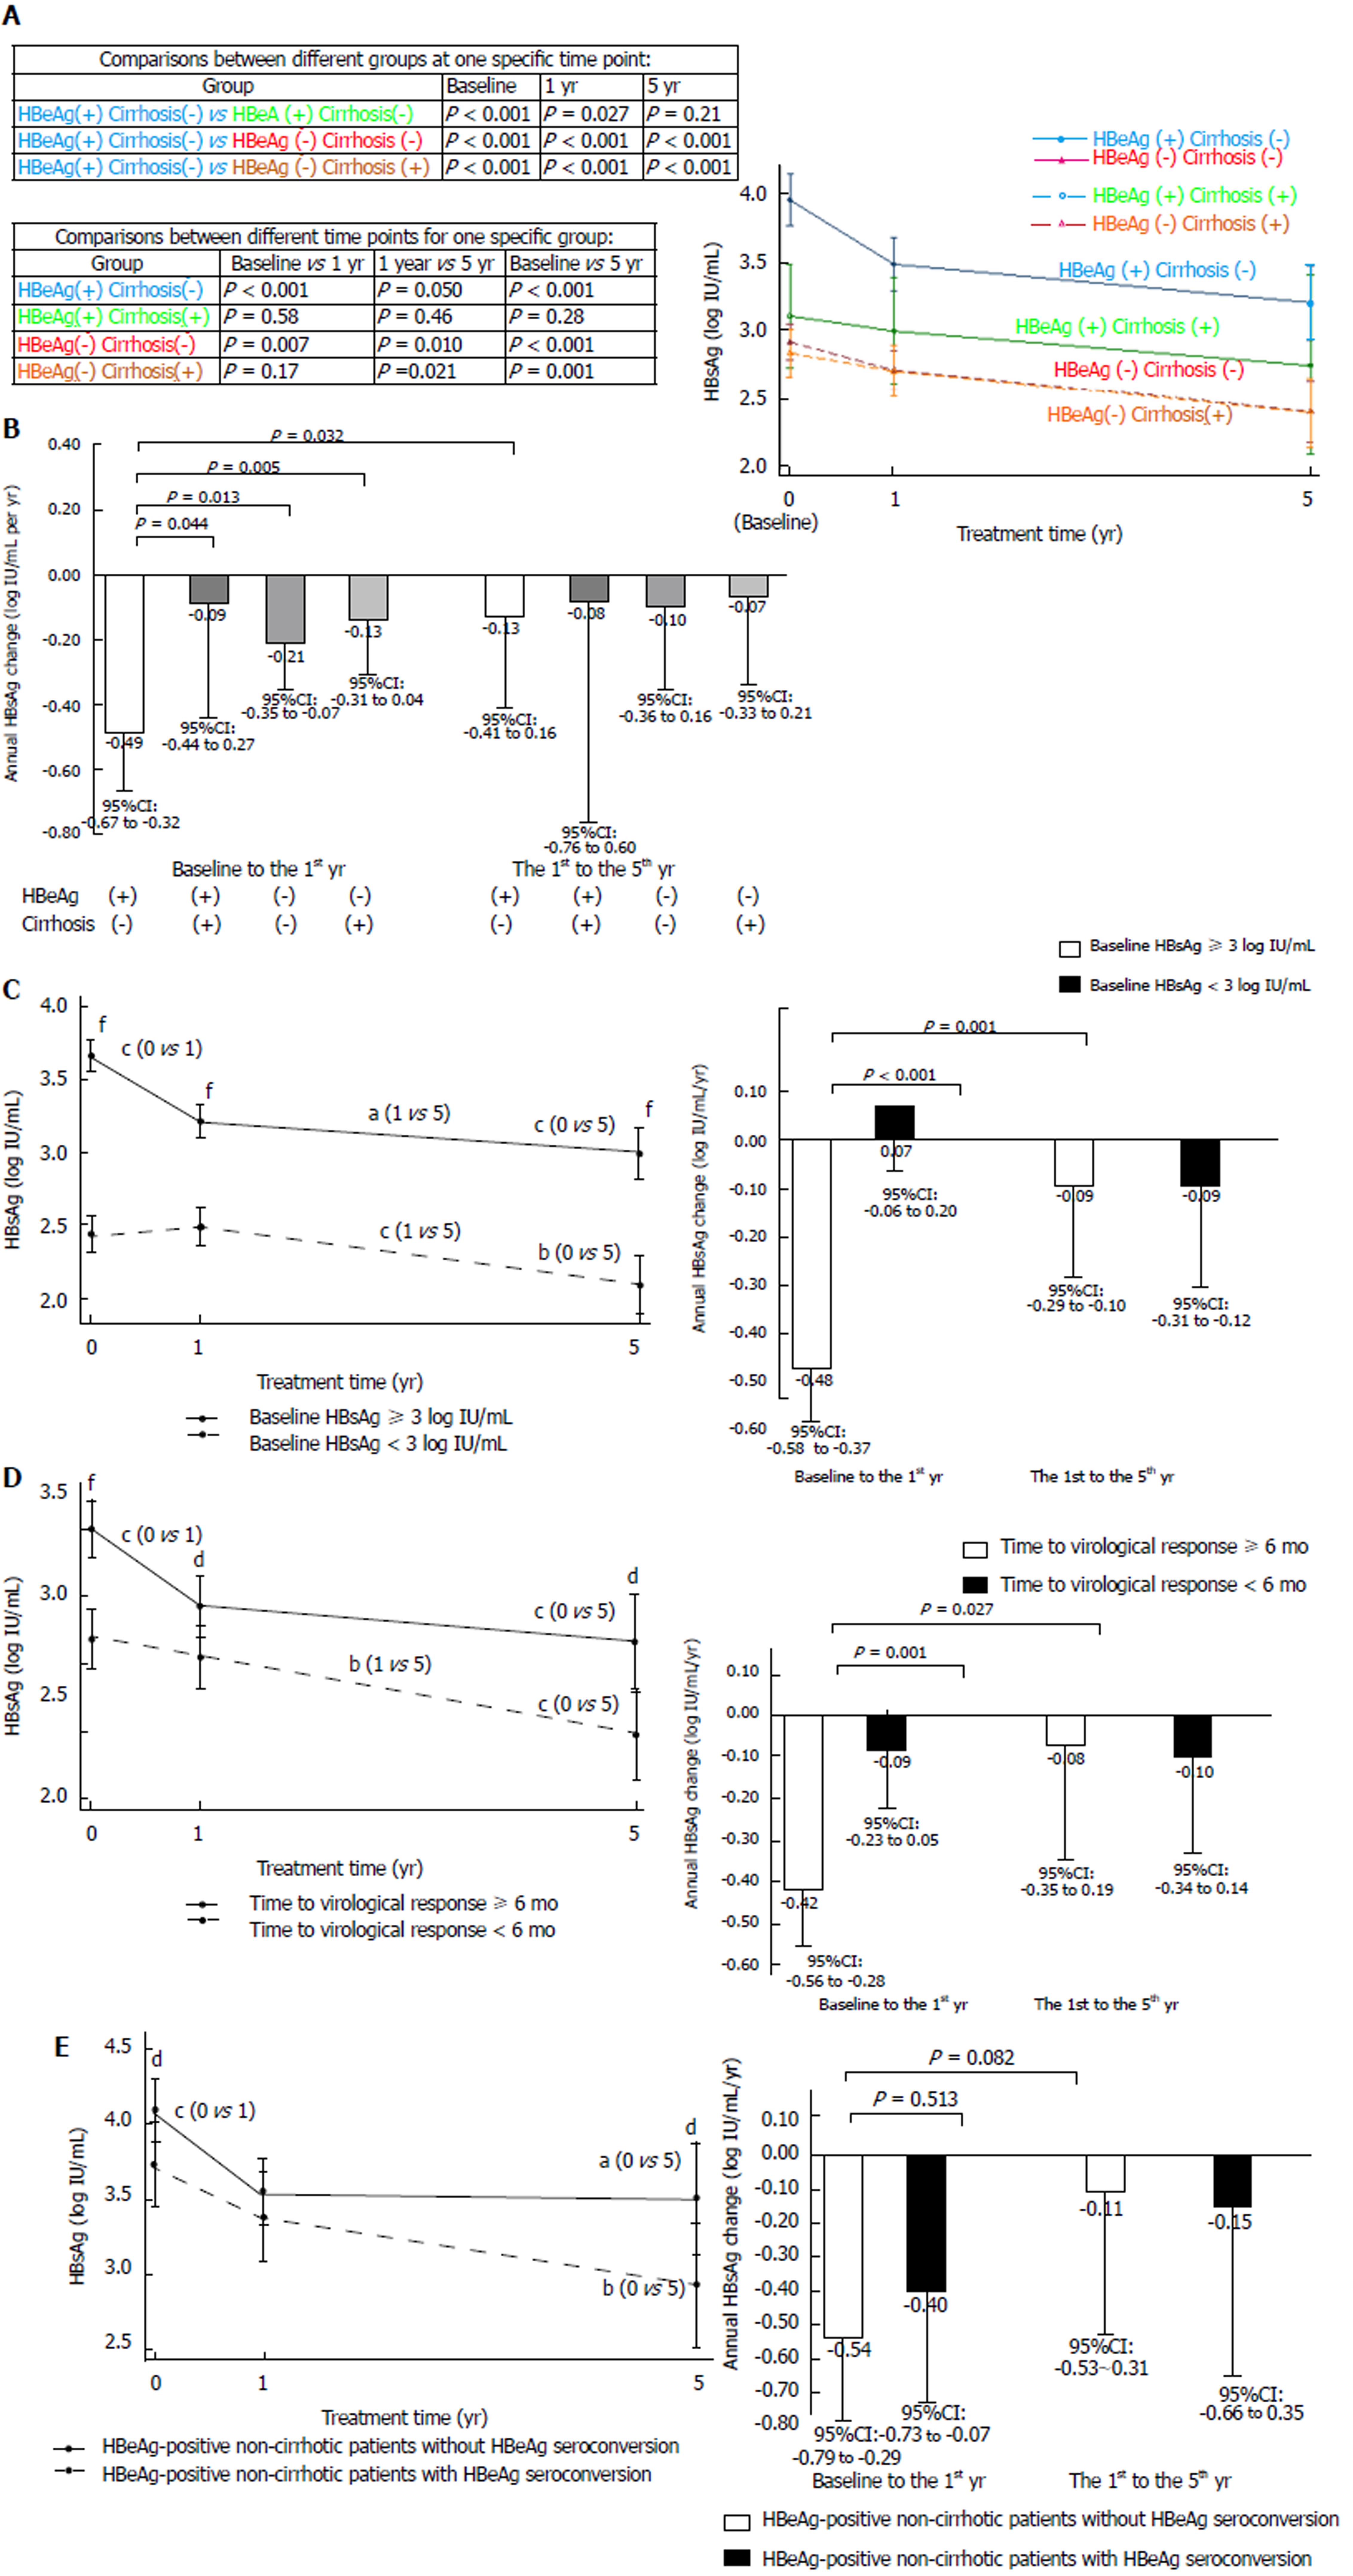
Figure 3 HBsAg kinetics during entecavir treatment.
A: HBsAg levels at different time points, categorized by baseline HBeAg and cirrhosis status; B: Annual HBsAg changes in different periods, categorized by baseline HBeAg and cirrhosis status; C: HBsAg levels and annual HBsAg changes, categorized by baseline HBsAg < 3 log IU/mL and ≥ 3 log IU/mL; D: HBsAg levels and annual HBsAg changes, categorized by time to virological response < 6 mo and ≥ 6 mo; E: HBsAg levels and annual HBsAg changes, categorized by HBeAg seroconversion in HBeAg-positive non-cirrhotic patients. Error bars represent 95% confidence intervals. Comparisons between different time points or periods for one patient group: aP < 0.05, bP < 0.005, cP < 0.001; Comparisons between different groups at one specific time point or period: dP < 0.05, eP < 0.005, fP < 0.001.
- Citation: Lin TC, Chiu YC, Chiu HC, Liu WC, Cheng PN, Chen CY, Chang TT, Wu IC. Clinical utility of hepatitis B surface antigen kinetics in treatment-naïve chronic hepatitis B patients during long-term entecavir therapy. World J Gastroenterol 2018; 24(6): 725-736
- URL: https://www.wjgnet.com/1007-9327/full/v24/i6/725.htm
- DOI: https://dx.doi.org/10.3748/wjg.v24.i6.725


