Copyright
©The Author(s) 2018.
World J Gastroenterol. Feb 7, 2018; 24(5): 583-592
Published online Feb 7, 2018. doi: 10.3748/wjg.v24.i5.583
Published online Feb 7, 2018. doi: 10.3748/wjg.v24.i5.583
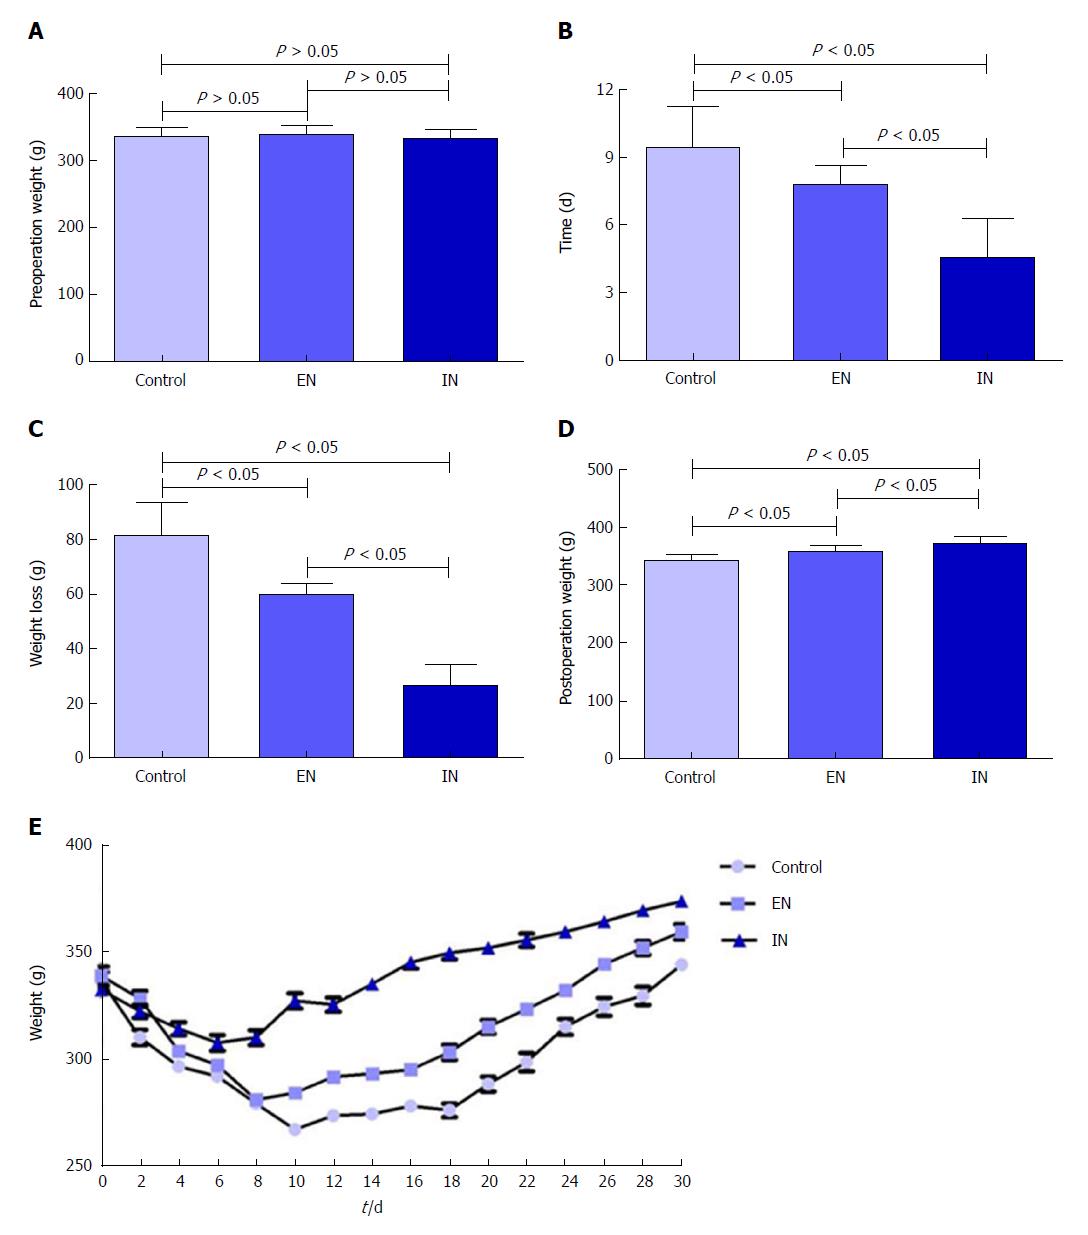
Figure 2 Body weight changes in rats during the study period.
A: Body weights were similar in all three groups pre-operatively (F = 0.57, P = 0.57); B Time to minimum weight was significantly longer in the control group compared with the EN (P < 0.05) and IN (P < 0.05) groups, and longer in the EN group compared with the IN group (P < 0.05); C: The weight decline was greater in the control group compared with the EN (P < 0.05) and IN (P < 0.05) groups, and greater in the EN compared with the IN group (P < 0.05); D: Body weight at 30 d postoperatively was significantly higher in the EN group compared with the control group (P < 0.05) and significantly lower compared with the IN group (P < 0.05); E: Weight-change curve for rats over 30 d postoperatively. Bars represent mean ± SD, n = 8. EN: Enteral nutrition; IN: Immune nutrition.
- Citation: Xu YY, He AQ, Liu G, Li KY, Liu J, Liu T. Enteral nutrition combined with glutamine promotes recovery after ileal pouch-anal anastomosis in rats. World J Gastroenterol 2018; 24(5): 583-592
- URL: https://www.wjgnet.com/1007-9327/full/v24/i5/583.htm
- DOI: https://dx.doi.org/10.3748/wjg.v24.i5.583


