Copyright
©The Author(s) 2018.
World J Gastroenterol. Feb 7, 2018; 24(5): 573-582
Published online Feb 7, 2018. doi: 10.3748/wjg.v24.i5.573
Published online Feb 7, 2018. doi: 10.3748/wjg.v24.i5.573
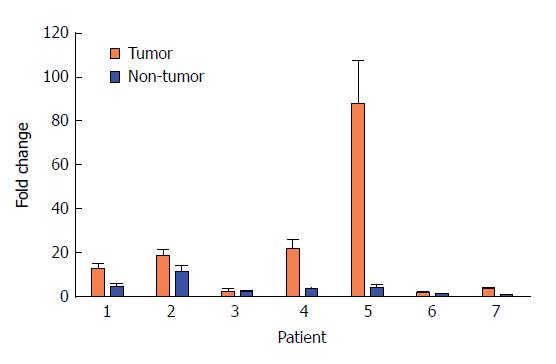
Figure 3 Quantitative RT-PCR analysis of miR-202-3p in type 1 g-neuroendocrine neoplasms and non-tumour gastric mucosal tissues.
The value of the lowest expression sample was set to 1, and thus, the fold change values indicate the relative trend of change in the expression levels among different samples.
- Citation: Dou D, Shi YF, Liu Q, Luo J, Liu JX, Liu M, Liu YY, Li YL, Qiu XD, Tan HY. Hsa-miR-202-3p, up-regulated in type 1 gastric neuroendocrine neoplasms, may target DUSP1. World J Gastroenterol 2018; 24(5): 573-582
- URL: https://www.wjgnet.com/1007-9327/full/v24/i5/573.htm
- DOI: https://dx.doi.org/10.3748/wjg.v24.i5.573


