Copyright
©The Author(s) 2018.
World J Gastroenterol. Feb 7, 2018; 24(5): 573-582
Published online Feb 7, 2018. doi: 10.3748/wjg.v24.i5.573
Published online Feb 7, 2018. doi: 10.3748/wjg.v24.i5.573
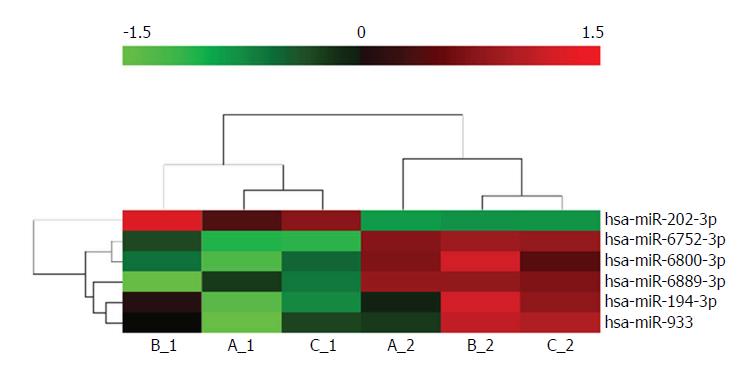
Figure 2 Hierarchical clustering analysis of differentially expressed miRNAs.
Differentially expressed miRNAs shown in the rows of the heatmap were clustered using Euclidean distance and complete linkage. The colour scale at the top illustrates the expression value of a particular miRNA on a log2 scale.
- Citation: Dou D, Shi YF, Liu Q, Luo J, Liu JX, Liu M, Liu YY, Li YL, Qiu XD, Tan HY. Hsa-miR-202-3p, up-regulated in type 1 gastric neuroendocrine neoplasms, may target DUSP1. World J Gastroenterol 2018; 24(5): 573-582
- URL: https://www.wjgnet.com/1007-9327/full/v24/i5/573.htm
- DOI: https://dx.doi.org/10.3748/wjg.v24.i5.573


