Copyright
©The Author(s) 2018.
World J Gastroenterol. Feb 7, 2018; 24(5): 573-582
Published online Feb 7, 2018. doi: 10.3748/wjg.v24.i5.573
Published online Feb 7, 2018. doi: 10.3748/wjg.v24.i5.573
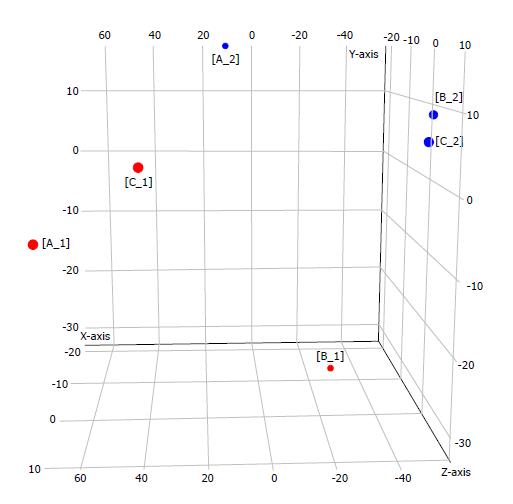
Figure 1 Principal component analysis plot of normalized miRNA expression values.
PCA was performed using R Bioconductor DESeq2. A clear separation between the tumour (red) and non-tumour (blue) samples was observed. PCA: Principal component analysis.
- Citation: Dou D, Shi YF, Liu Q, Luo J, Liu JX, Liu M, Liu YY, Li YL, Qiu XD, Tan HY. Hsa-miR-202-3p, up-regulated in type 1 gastric neuroendocrine neoplasms, may target DUSP1. World J Gastroenterol 2018; 24(5): 573-582
- URL: https://www.wjgnet.com/1007-9327/full/v24/i5/573.htm
- DOI: https://dx.doi.org/10.3748/wjg.v24.i5.573


