Copyright
©The Author(s) 2018.
World J Gastroenterol. Dec 21, 2018; 24(47): 5351-5365
Published online Dec 21, 2018. doi: 10.3748/wjg.v24.i47.5351
Published online Dec 21, 2018. doi: 10.3748/wjg.v24.i47.5351
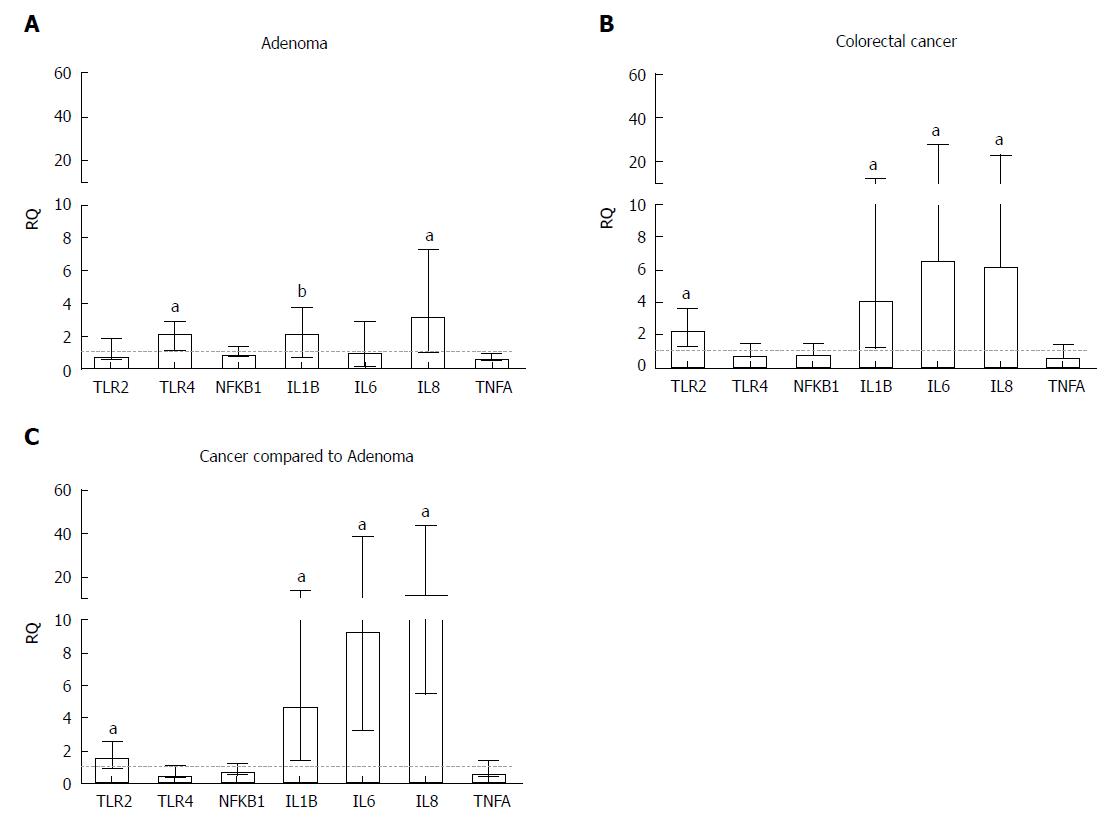
Figure 2 Relative quantification of inflammatory genes in (A) adenoma and (B) colorectal tumour tissue samples compared to a pool of respective adjacent normal tissue samples and (C) colorectal tumour tissue samples compared to adenoma samples.
All samples were normalized to the reference genes ACTB and GAPDH. Statistically significant differences, according to the Wilcoxon signed-rank test, were aP ≤ 0.001 and bP ≤ 0.01. Median with interquartile range graph. RQ: Relative quantification.
- Citation: Proença MA, Biselli JM, Succi M, Severino FE, Berardinelli GN, Caetano A, Reis RM, Hughes DJ, Silva AE. Relationship between Fusobacterium nucleatum, inflammatory mediators and microRNAs in colorectal carcinogenesis. World J Gastroenterol 2018; 24(47): 5351-5365
- URL: https://www.wjgnet.com/1007-9327/full/v24/i47/5351.htm
- DOI: https://dx.doi.org/10.3748/wjg.v24.i47.5351


