Copyright
©The Author(s) 2018.
World J Gastroenterol. Dec 14, 2018; 24(46): 5271-5279
Published online Dec 14, 2018. doi: 10.3748/wjg.v24.i46.5271
Published online Dec 14, 2018. doi: 10.3748/wjg.v24.i46.5271
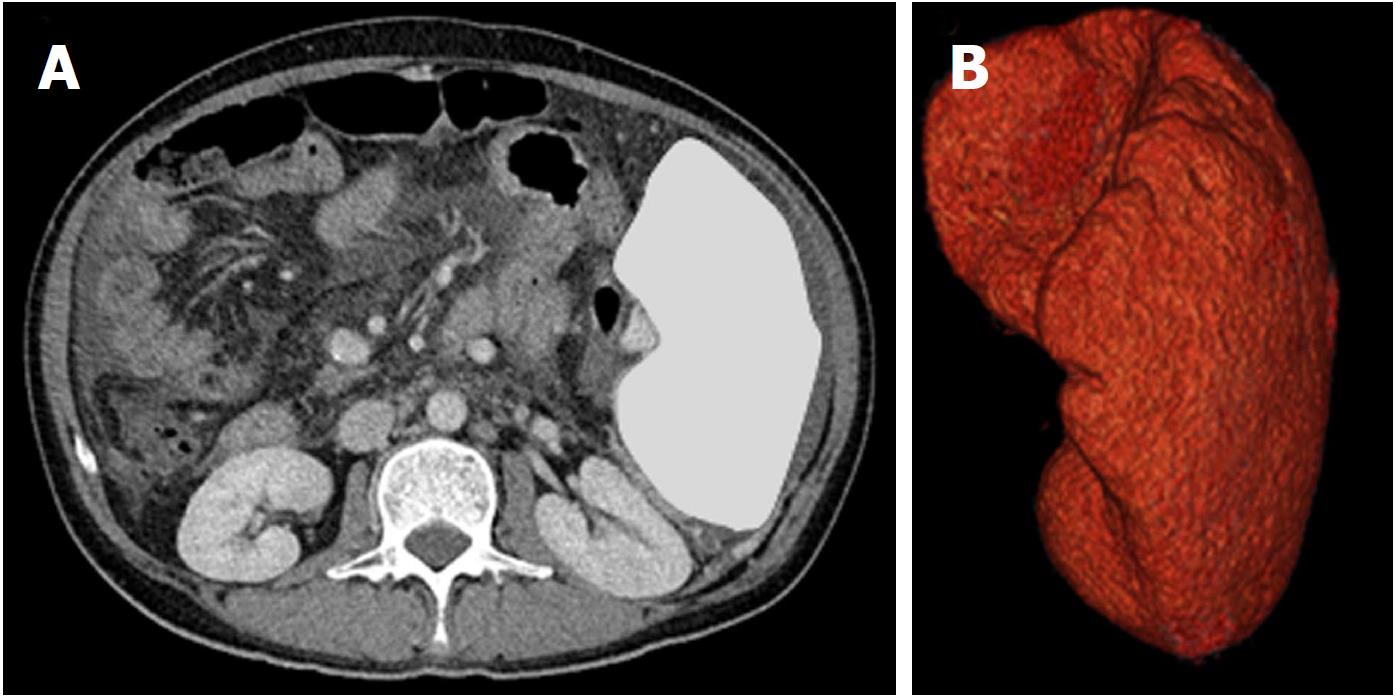
Figure 1 Axial computed tomography section (A) and reconstructed 3-D image (B) of the spleen.
The volume measurement was performed using virtual organ computer-aided analysis on enhanced computed tomography in an enrolled patient with splenomegaly. The total volume was 1212 mL calculated using the software.
- Citation: Uojima H, Arase Y, Itokawa N, Atsukawa M, Satoh T, Miyazaki K, Hidaka H, Sung JH, Kako M, Tsuruya K, Kagawa T, Iwakiri K, Horie R, Koizumi W. Relationship between response to lusutrombopag and splenic volume. World J Gastroenterol 2018; 24(46): 5271-5279
- URL: https://www.wjgnet.com/1007-9327/full/v24/i46/5271.htm
- DOI: https://dx.doi.org/10.3748/wjg.v24.i46.5271


