Copyright
©The Author(s) 2018.
World J Gastroenterol. Dec 14, 2018; 24(46): 5259-5270
Published online Dec 14, 2018. doi: 10.3748/wjg.v24.i46.5259
Published online Dec 14, 2018. doi: 10.3748/wjg.v24.i46.5259
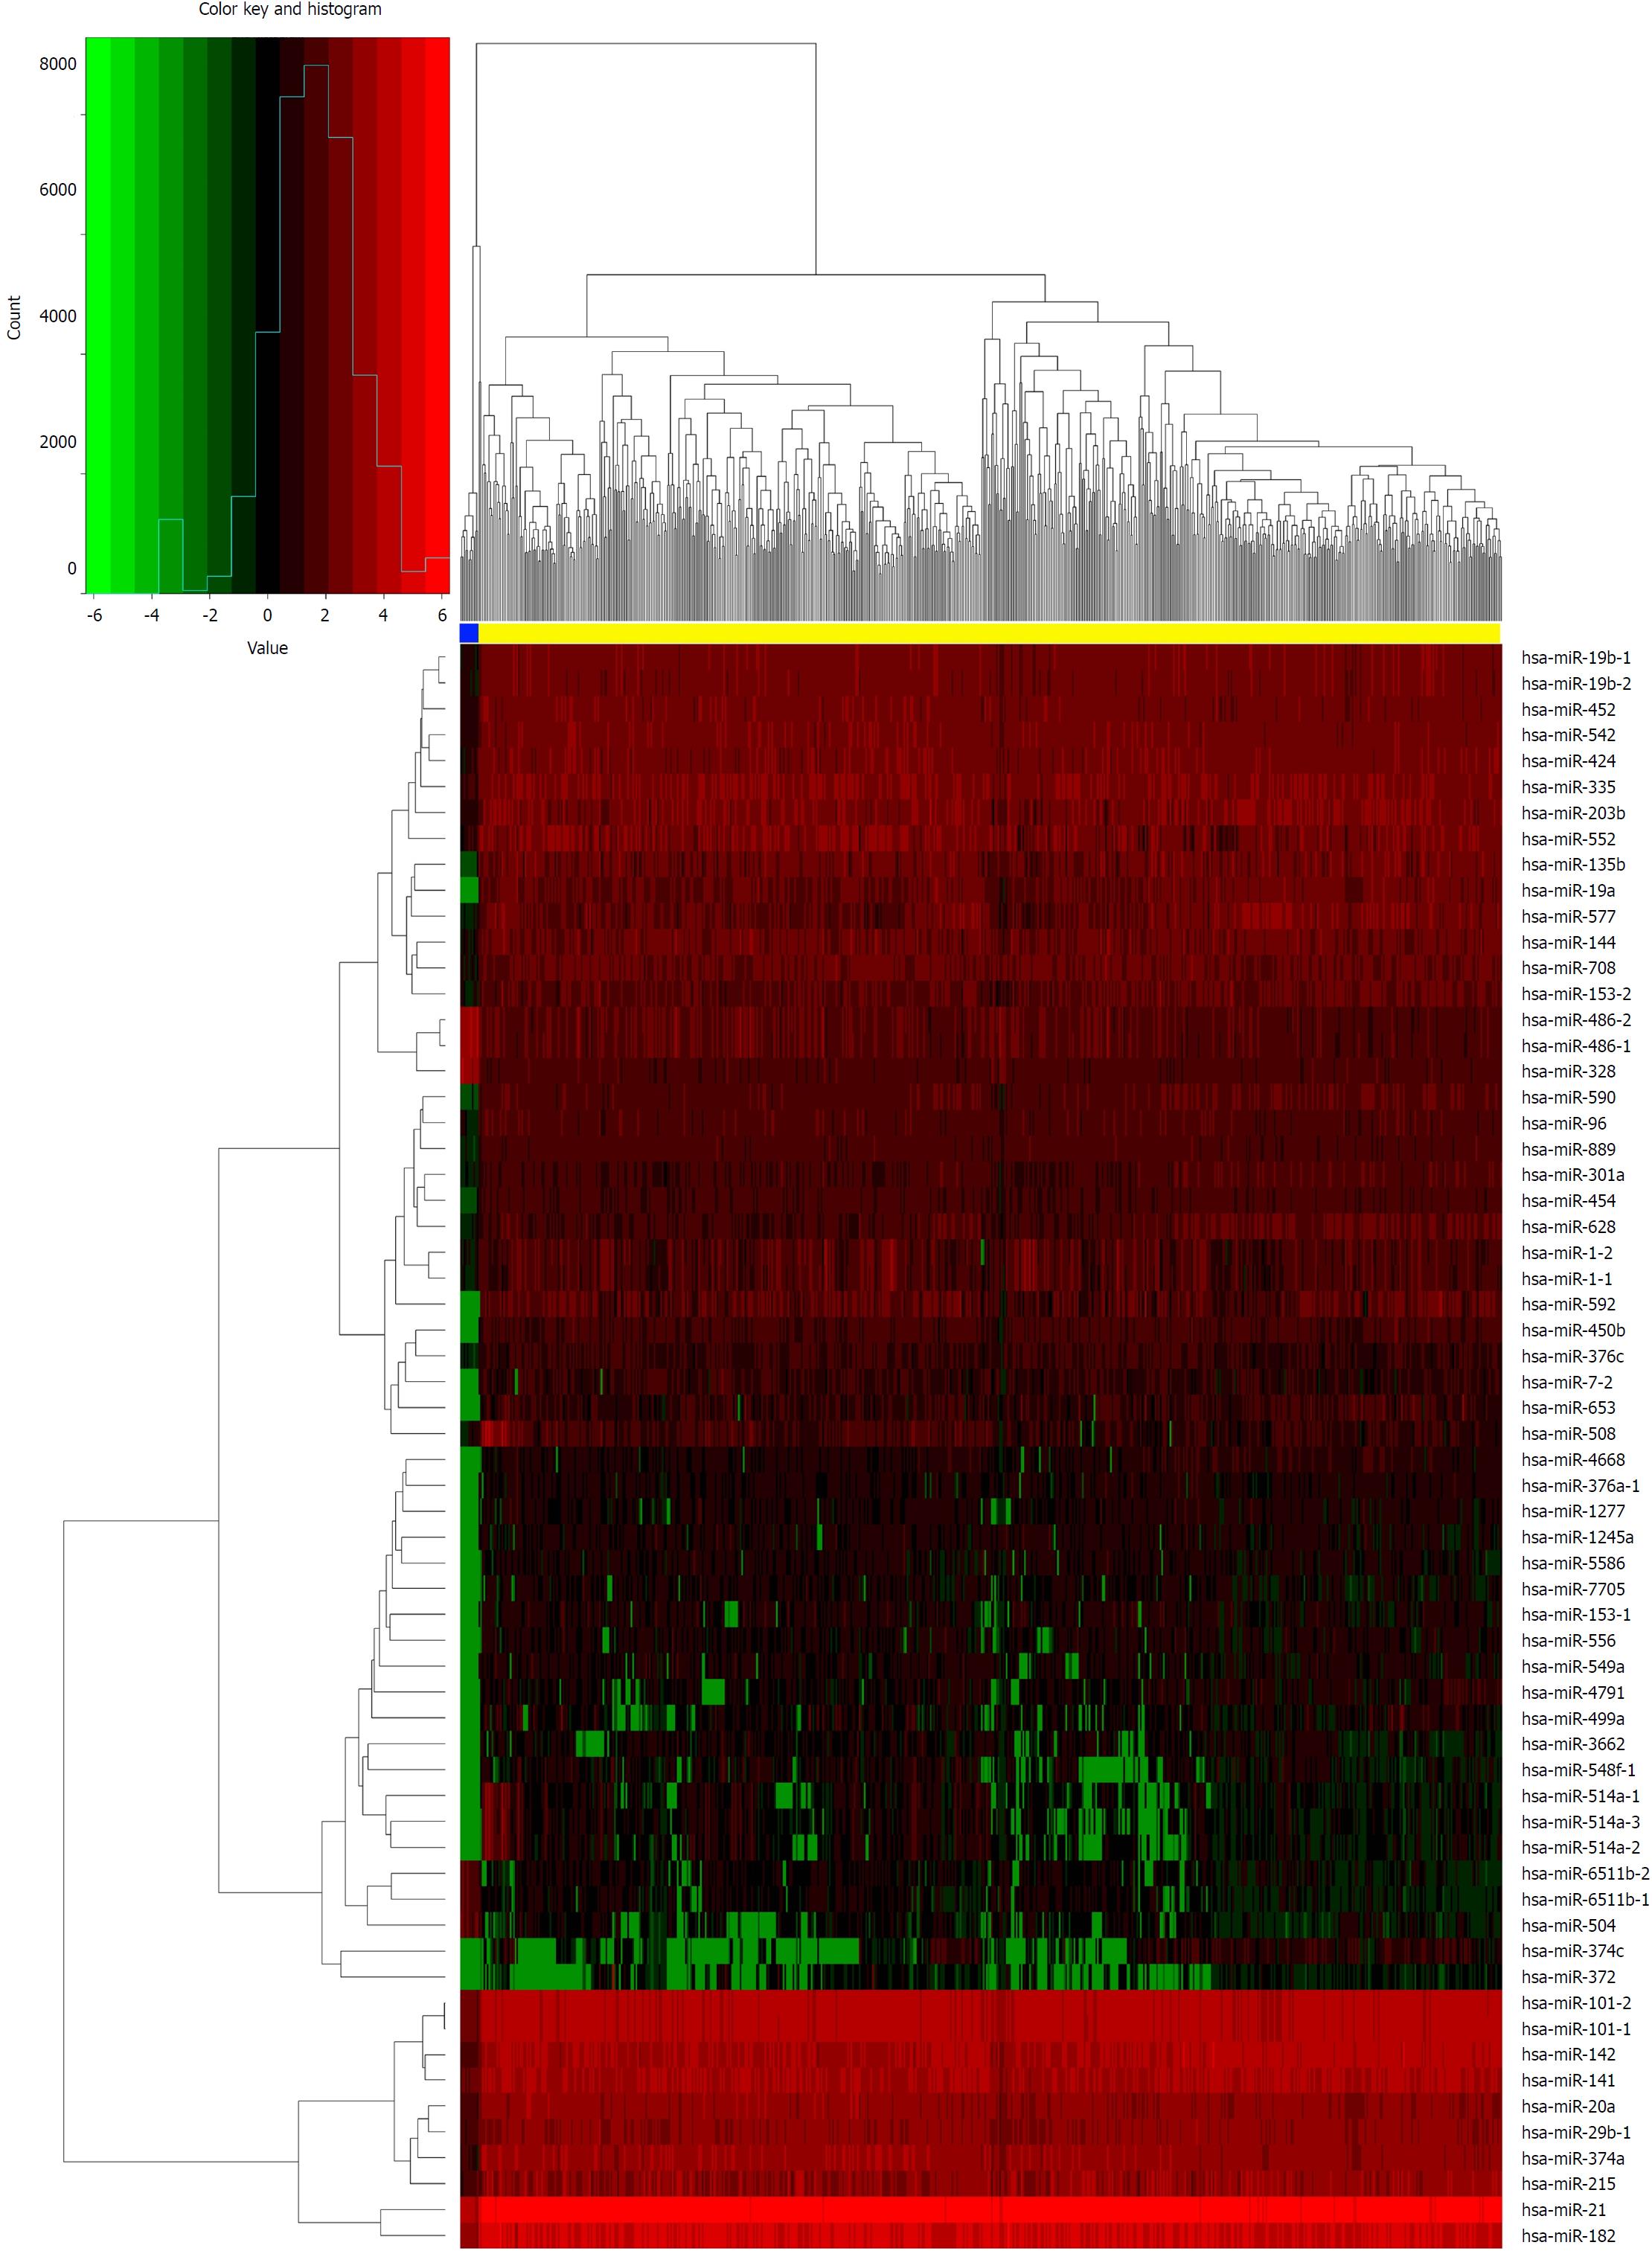
Figure 3 Heat map of differentially expressed microRNAs (log2 FC > 5, P < 0.
01). The above horizontal axis shows clusters of samples. The left vertical axis shows clusters of differentially expressed microRNAs (DEmiRNAs) and right vertical axis represents miRNA names. Red represents up-regulated genes and green represents down-regulated genes. The yellow color column represents colorectal cancer; the blue represents normal.
- Citation: Liang Y, Zhang C, Ma MH, Dai DQ. Identification and prediction of novel non-coding and coding RNA-associated competing endogenous RNA networks in colorectal cancer. World J Gastroenterol 2018; 24(46): 5259-5270
- URL: https://www.wjgnet.com/1007-9327/full/v24/i46/5259.htm
- DOI: https://dx.doi.org/10.3748/wjg.v24.i46.5259


